TruthArchive.ai - Tweets Saved By @NiusMarco

Saved - February 17, 2024 at 10:24 AM
reSee.it AI Summary
In the final report of the Pfizer trial, there is no mention or table regarding the count of severe COVID cases, which was one of the objectives of the trial. They are only mentioned with small "s" on the curves, more numerous among the vaccinated in absolute value, but without being able to calculate the incidence. With 40,000 people followed for 2 years and the criteria used to define a severe COVID case, the conclusion would be that COVID is not more dangerous than a rhinovirus with less than 100 severe cases. The lack of provided numbers suggests they are unfavorable.

@NiusMarco - marco nius

1/3 Dans le rapport final de l'essai pfizer il n'y a aucune mention ni tableau du dénombrement des covids sévères. Ce qui était pourtant un des objectifs de l'essai Pourquoi https://t.co/ndbISIS3WU

@NiusMarco - marco nius

2/3 Ils sont juste mentionnés avec des petit "s" sur les courbes, bien plus nombreux chez les vaccinés en valeur absolue mais sans qu'on ne puisse calculer l'incidence, n'ayant pas accès à la valeur de référence "person-year" https://t.co/Y5F90sbgsj

@NiusMarco - marco nius

Avec 40000 personnes suivies 2 ans et les critères retenus pour définir un covid sévère la conclusion qui s'impose serait que le Covid n'est pas plus dangereux qu'un rhinovirus avec moins de "100 Covid sévères". Et que s'ils ne donnent pas les chiffres c'est qu'ils sont mauvais https://t.co/DRJ8G2vd6E

Saved - January 27, 2024 at 12:38 AM
reSee.it AI Summary
Norwegian study finds significant excess mortality unrelated to Covid, particularly from cardiovascular causes starting in July 2021. Researchers are still exploring possible explanations. Should we inform them?

@NiusMarco - marco nius

Etude norvégienne sur la grosse surmortalité Non Covid. Surtout cardiovasculaires à partir de juillet 2021 Ils n'ont pas trop d'idées mais ils réfléchissent encore🙄 On leur dit ?

@NiusMarco - marco nius

@NiusMarco - marco nius

https://bmcpublichealth.biomedcentral.com/articles/10.1186/s12889-023-17515-5

Excess non-COVID-19 mortality in Norway 2020–2022 - BMC Public Health Causes of death other than COVID-19 seem to contribute significantly to the excess mortality observed during the 2020–2022 pandemic. In this study, we explore changes in non-COVID-19 causes of death in Norway during the COVID-19 pandemic from March 2020 to December 2022. We performed a population-based cross-sectional study on data from the Norwegian Cause of Death Registry. All recorded deaths from 1st January 2010 to 31st December 2022 were included. The main outcome measures were the number of deaths and age-standardised death rate (ASMR) per 100000 population from the major cause of death groups in 2020, 2021 and 2022. The predicted number of deaths and ASMRs were forecasted with a 95% prediction interval constructed from a general linear regression model based on the corresponding number of deaths and rates from the preceding ten prepandemic years (2010–2019). We also examined whether there were deviations from expected seasonality in the pandemic period based on prepandemic monthly data from 2010–2019. The cumulative number of deaths and ASMR were estimated based on monthly mortality data. There was significant excess mortality (number of deaths) in 2021 and 2022 for all causes (3.7% and 14.5%), for cardiovascular diseases (14.3% and 22.0%), and for malignant tumours in 2022 (3.5%). In terms of ASMR, there was excess mortality in 2021 and 2022 for all causes (2.9% and 13.7%), and for cardiovascular diseases (16.0% and 25,8%). ASMR was higher than predicted in 2022 for malignant tumours (2.3%). There were fewer deaths than predicted from respiratory diseases (except COVID-19) in 2020 and 2021, and from dementia in 2021 and 2022. From March 2020 to December 2022, there were cumulatively 3754 (ASMR 83.8) more non-COVID-19 deaths than predicted, of which 3453 (ASMR: 79.6) were excess deaths from cardiovascular disease, 509 (ASMR 4.0) from malignant tumours. Mortality was lower than predicted for respiratory diseases (-1889 (ASMR: -44.3)), and dementia (-530 (ASMR -18.5)). There was considerable excess non-COVID-19 mortality in Norway from March 2020 until December 2022, mainly due to excess cardiovascular deaths. For respiratory diseases and dementia, mortality was lower than predicted. bmcpublichealth.biomedcentral.com
Saved - November 1, 2023 at 1:06 PM

@NiusMarco - marco nius

Surmortalité Mondiale + Mortalité Covid + Doses de vaccins callés au jour près Co-co-co- coïncidences Si les pics de vaccinations 3 et 4 semblent faibles n'oubliez pas qu'ils ne concernent quasiment que les plus âgés. Les plus jeunes ayant rarement fait + de 2 doses. https://t.co/v2qJ9oWf4X

Saved - October 26, 2023 at 7:39 PM

@NiusMarco - marco nius

Le réchauffement entre 1915 et 1944 est exactement le même que celui de 1994-2023 . Avec 8 fois plus d'émissions (annuelles ou cumulées). Pourtant le GIEC affirme que leur contribution au réchauffement depuis 1850 est de 100% . C'est juste impossible https://t.co/SrXT3ClHbo

Saved - October 14, 2023 at 4:25 PM

@NiusMarco - marco nius

Confirmé par les courbes de températures du Groenland

Saved - September 19, 2023 at 1:44 PM

@NiusMarco - marco nius

Les maisons Viking entières datées de 750-1150 retrouvées récemment lors de la fonte du glacier Lenbreen en Norvège. Donc, Au moins 400 années plus chaudes qu'aujourd'hui. 63 sites de fouille.

Melting Ice and a High Altitude Dig Reveal Viking Secrets in Norway A wealth of ancient artifacts may be discovered as high altitude ice melts, but the relationship between high altitude archaeology and climate change is a somber one. news.climate.columbia.edu
Saved - September 18, 2023 at 11:26 AM
reSee.it AI Summary
In the past 3 years, polar ice loss has stabilized, aligning with temperature stability since 2016. Surprisingly, this positive development is often overlooked by alarmists. Additionally, the rate of sea level rise has slightly decreased, although updates have been infrequent since April.

@NiusMarco - marco nius

Les pôles ne perdent plus de glace depuis un peu plus de 3 ans. Ce qui n'est pas énorme mais qui est cohérent avec la stabilisation des températures depuis 2016 Comme par hasard aucun alarmiste n'en parle 🤔 Toujours cacher les bonnes nouvelles https://t.co/NaEZ15ZUDl

@NiusMarco - marco nius

Le rythme de montée des océans diminue aussi légèrement , c'est léger mais bizarrement ils n'ont pas mis à jour depuis Avril. Ce qui est inhabituel https://t.co/rxr6k300Ex

Saved - September 17, 2023 at 12:38 AM
reSee.it AI Summary
The temperatures in the southern hemisphere from 1850 to 1900 are well known. Urban warming in Dakar seems to be nonexistent; in fact, it is becoming more rural. I showed you the worst five out of ten examples. Soon, I'll provide a more comprehensive overview of South America and Africa. Spain is also interesting.

@NiusMarco - marco nius

Ils connaissent très bien les températures de 1850 à 1900 dans l'hémisphère SUD 😂 Mesdames Messieurs .... Les stations !! sous vos applaudissements https://t.co/fZAxyx4Vqm

@NiusMarco - marco nius

Goûtez les "homogénisations" au passage Apparemment le réchauffement Urbain à Dakar n'existe pas , bien au contraire. ça se ruralise. C'est connu https://t.co/n5SgFuGMW9

@NiusMarco - marco nius

J'avoue vous avoir montré les 5 pires parmi 10. Je vous fait un topo bientôt sur l'amérique du sud et l'Afrique Plus exhaustif https://t.co/zqt9iKrDKn

@NiusMarco - marco nius

Et l'Espagne aussi, intéressant https://t.co/qnc3sKXPHy

Saved - September 8, 2023 at 10:50 AM
reSee.it AI Summary
@NiusMarco shared a link to a CV but had to delete it. @DjaonBea commented on freedom of expression.

@NiusMarco - marco nius

Voilà ! Faut pas publier les CV des mecs du GIEC, c'est censuré .J'ai dû supprimer la publication Du coup je met le lien internet, Puisque cette page n'est pas privée. On verra si ça bloque aussi https://www.hugo.uliege.be/upload/docs/application/pdf/2020-10/cv_francois_gemenne_-_english.pdf

@DjaonBea - ✨DJΛӨП BΣΛ✨ (🌿🌺🍀🌳)❤️CO2

@NiusMarco La liberté d'expression selon X !!!

Saved - September 7, 2023 at 11:28 PM
reSee.it AI Summary
The influx of carbon credit predators claims to be an independent governing body for the voluntary carbon market. However, carbon credits resemble a massive Ponzi scheme lacking real value. Imposing regulations is crucial to prevent its potential explosion. It's a concerning situation.

@NiusMarco - marco nius

Les rapaces du crédit carbone arrivent en masse. Ils se définissent comme :" un organe de gouvernance indépendant pour le marché volontaire du carbone." 😬 Les crédits carbone c'est la plus gigantesque chaîne de ponzi jamais montée Elle devra être imposée et

@NiusMarco - marco nius

s'amplifier pour ne pas exploser. Puis qu'il n'y a aucune réelle valeur ajoutée. C'est flippant.

Saved - September 7, 2023 at 12:04 AM
reSee.it AI Summary
In a 2010 study on wild birds, it was found that almost all species carry coronaviruses. Geese and ducks, known for their long-distance travel, can transmit these viruses to captive birds and other wildlife. Evading such viruses is impossible.

@NiusMarco - marco nius

étude 2010 chez les oiseaux sauvages. Quasiment toutes les espèces sont porteuses de coronavirus. Notamment les oies et les canards qui peuvent parcourir des milliers de km et transmettre aux oiseaux d'élevages ou autres espèces sauvages Esquiver ce genre de virus est impossible

@NiusMarco - marco nius

https://journals.plos.org/plosone/article?id=10.1371/journal.pone.0013640

Prevalence and Phylogeny of Coronaviruses in Wild Birds from the Bering Strait Area (Beringia) Coronaviruses (CoVs) can cause mild to severe disease in humans and animals, their host range and environmental spread seem to have been largely underestimated, and they are currently being investigated for their potential medical relevance. Infectious bronchitis virus (IBV) belongs to gamma-coronaviruses and causes a costly respiratory viral disease in chickens. The role of wild birds in the epidemiology of IBV is poorly understood. In the present study, we examined 1,002 cloacal and faecal samples collected from 26 wild bird species in the Beringia area for the presence of CoVs, and then we performed statistical and phylogenetic analyses. We detected diverse CoVs by RT-PCR in wild birds in the Beringia area. Sequence analysis showed that the detected viruses are gamma-coronaviruses related to IBV. These findings suggest that wild birds are able to carry gamma-coronaviruses asymptomatically. We concluded that CoVs are widespread among wild birds in Beringia, and their geographic spread and frequency is higher than previously realised. Thus, Avian CoV can be efficiently disseminated over large distances and could be a genetic reservoir for future emerging pathogenic CoVs. Considering the great animal health and economic impact of IBV as well as the recent emergence of novel coronaviruses such as SARS-coronavirus, it is important to investigate the role of wildlife reservoirs in CoV infection biology and epidemiology. journals.plos.org
Saved - September 6, 2023 at 11:04 PM
reSee.it AI Summary
A user expressed concern that children with multiple disabilities have not had their teeth brushed for 2.5 years due to COVID precautions. Another user questioned why COVID was relevant to this decision. The first user explained it was a precautionary measure. A third user criticized the lack of dental hygiene as criminal.

@NiusMarco - marco nius

Dans la série les connards donnent des ordres et les moutons obéissent ma fille qui travaille avec des enfants poly handicapés vient de m'apprendre qu'ils avaient arrêté de leur brosser les dents pour cause COVID depuis 2 ans et demi Tous vaccinés Ils l'ont quand même tous choppé

@DocCacahuete - 𝘗𝘪𝘳𝘰𝘶𝘦𝘵𝘵𝘦 𝘊𝘢𝘤𝘢𝘩𝘶𝘦̀𝘵𝘦

@NiusMarco Si je comprend bien ces enfants n'ont pas eu d'hygiène dentaire depuis 2,5 ans et personne ne s'en est insurgé ? Mais sinon, je comprends pas bien ce que le covid vient faire dans l'histoire de cette décision (inadmissible de la part d'1 institution en charge de handicapés) ?

@NiusMarco - marco nius

@DocCacahuete consigne pour éviter les transmissions 🤦‍♂️

@LucileFievet - Complot bisiste😗😙😚😘🇦🇲

@NiusMarco @DocCacahuete Claude Escarguel avait bien expliqué l'importance de l'hygiène des gencives... C'est tout simplement criminel 🤬

Saved - September 6, 2023 at 9:04 PM

@NiusMarco - marco nius

Nouvelle étude : Selon les observations du CERES, l'anomalie de rayonnement à ondes courtes (SW) a augmenté de +1,75 W/m² de 2001 à 2021, ce qui est probablement dû aux variations naturelles de la couverture nuageuse. Ce forçage SW peut expliquer le réchauffement (0,46°c)

@Kenneth72712993 - Kenneth Richard

New study: Per CERES observations, the shortwave (SW) radiation anomaly increased by +1.75 W/m² from 2001 to 2021, which is likely due to natural variations in cloud cover. This SW forcing can explain warming (0.46°C) over this period. https://scienceofclimatechange.org/wp-content/uploads/Olilla-2023-Global-Warming-Review.pdf

404 - Science of climate change scienceofclimatechange.org
Saved - September 6, 2023 at 3:41 PM

@NiusMarco - marco nius

La science fait partie de la société. Quand celle ci devient totalitaire, la science le fait aussi. L'autocensure ou la soumission sont en général les principaux leviers. Même pas besoin de corrompre en Cash directement

@Elpis_R - Ξlpis

Le seul moyen d’être publié sur le climat dans une revue comme Nature, c’est de “soutenir le récit catastrophiste et la politique de réduction de CO2” quitte à “induire le public en erreur. Si on s’écarte de cette formule on est rejeté et on doit s’exiler” https://www.thefp.com/p/i-overhyped-climate-change-to-get-published

I Left Out the Full Truth to Get My Climate Change Paper Published I just got published in Nature because I stuck to a narrative I knew the editors would like. That’s not the way science should work. thefp.com
Saved - August 26, 2023 at 1:09 PM
reSee.it AI Summary
The loss of Antarctic ice is primarily attributed to geothermal activity, as confirmed by NASA's study on ice loss since 2002. The study focuses on the exact geothermal flux in the same region, unrelated to potential warming. For more details, visit: [link].

@NiusMarco - marco nius

La perte de glace de la calotte antarctique est totalement due (ou quasiment) à l'activité géothermale Tweet 1 : les pertes de glaces depuis 2002 selon la Nasa Tweet 2 : étude sur le flux géothermal exactement dans la même région Aucun rapport avec un éventuel réchauffement

@NiusMarco - marco nius

https://www.nature.com/articles/s43247-021-00242-3/figures/3

Fig. 3: Geothermal heat flow, lithospheric elastic thickness and magnetic anomaly distribution of the Amundsen Sea sector. | Communications Earth & Environment nature.com

@NiusMarco - marco nius

lien https://svs.gsfc.nasa.gov/31158

NASA Scientific Visualization Studio | Antarctic Ice Mass Loss 2002-2023 The mass of the Antarctic ice sheet has changed over the last decades. Research based on observations from the Gravity Recovery and Climate Experiment (GRACE) satellites (2002-2017) and GRACE Follow-On (since 2018 - ) indicates that between 2002 and 2023, Antarctica shed approximately 150 gigatons of ice per year, causing global sea level to rise by 0.4 millimeters per year. These images, created from GRACE and GRACE-FO data, show changes in Antarctic ice mass since 2002. Orange and red shades indicate areas that lost ice mass, while light blue shades indicate areas that gained ice mass. White indicates areas where there has been very little or no change in ice mass since 2002. Areas in East Antarctica experienced modest amounts of mass gain due to increased snow accumulation. However, this gain is more than offset by significant ice mass loss on the West Antarctic Ice Sheet (dark red) over the 21-year period. Floating ice shelves whose mass change GRACE & GRACE-FO do not measure are colored gray. The average flow lines (grey; created from satellite radar interferometry) of Antarctica’s ice converge into the locations of prominent outlet glaciers, and coincide with areas of highest mass loss (i.e., Pine Island and Thwaites glaciers in West-Antarctica). This supports other observations that warming ocean waters around Antarctica play a key role in contemporary ice mass loss. || svs.gsfc.nasa.gov
Saved - August 22, 2023 at 9:27 PM
reSee.it AI Summary
A conversation on climate change and a supposed CIA report from 1974. @NiusMarco claims the report predicted global cooling and a return to an ice age. @RedZeBot1 debunks the myth, providing a link to a scientific journal. @NiusMarco disputes the existence of the report. @RedZeBot1 accuses @NiusMarco of cherry-picking information. @NiusMarco mocks @RedZeBot1's support for Davos. @Elpis_R joins, claiming a consensus of 83% on global cooling in the 60s-70s and accuses Wikipedia of deleting related content. @NiusMarco praises @Elpis_R.

@NiusMarco - marco nius

TREAD 1/N rapport CIA 1974 Changement climatique Avec le consensus climatique mondial ils annoncent le CC avec sécheresses , inondations, famines, migrations massives à cause du refroidissement , climat "néo-Boréal"- retour au petit âge glaciaire

@RedZeBot1 - RedZeBot

@NiusMarco Ce mythe a été débunké depuis longtemps Marco. https://journals.ametsoc.org/view/journals/bams/89/9/2008bams2370_1.xml

THE MYTH OF THE 1970s GLOBAL COOLING SCIENTIFIC CONSENSUS Climate science as we know it today did not exist in the 1960s and 1970s. The integrated enterprise embodied in the Nobel Prizewinning work of the Intergovernmental Panel on Climate Change existed then as separate threads of research pursued by isolated groups of scientists. Atmospheric chemists and modelers grappled with the measurement of changes in carbon dioxide and atmospheric gases, and the changes in climate that might result. Meanwhile, geologists and paleoclimate researchers tried to understand when Earth slipped into and out of ice ages, and why. An enduring popular myth suggests that in the 1970s the climate science community was predicting “global cooling” and an “imminent” ice age, an observation frequently used by those who would undermine what climate scientists say today about the prospect of global warming. A review of the literature suggests that, on the contrary, greenhouse warming even then dominated scientists' thinking as being one of the most important forces shaping Earth's climate on human time scales. More importantly than showing the falsehood of the myth, this review describes how scientists of the time built the foundation on which the cohesive enterprise of modern climate science now rests. journals.ametsoc.org

@NiusMarco - marco nius

@RedZeBot1 Oui. Ce rapport n'existent pas. La conférence internationale citée dedans non plus. Même pas vrai.

@RedZeBot1 - RedZeBot

@NiusMarco Si mais tu fais du cherry-picking et un gros zoom sur ce qui t'intéresse, sans que ça soit représentatif de l'état de l'art à cette époque. Comme font les médias... comme à ton habitude ...

@NiusMarco - marco nius

@RedZeBot1 🙈🙉🙊 continuez à soutenir Davos. Ce sont des vrais écologistes. 😂

@Elpis_R - Ξlpis

@NiusMarco @RedZeBot1 Un consensus des études scientifiques de 83% sur un refroidissement global entre les années 60-70. Ils ont tout supprimer sur wikipédia. Voici les 285 études : https://notrickszone.com/285-papers-70s-cooling-1/

285 Papers 70s Cooling 1 notrickszone.com

@NiusMarco - marco nius

@Elpis_R @RedZeBot1 Whaou. Tu es toujours au top 😁👍

Saved - August 22, 2023 at 9:24 PM
reSee.it AI Summary
A conversation on climate change and its predictions took place. @NiusMarco mentioned the CIA's 1974 report on global cooling leading to droughts, floods, famines, and migrations. @MariuszDyminski shared a link to a publication curve, which @NiusMarco mistook for a temperature curve. @MariuszDyminski clarified, and @NiusMarco acknowledged the misunderstanding.

@NiusMarco - marco nius

TREAD 1/N rapport CIA 1974 Changement climatique Avec le consensus climatique mondial ils annoncent le CC avec sécheresses , inondations, famines, migrations massives à cause du refroidissement , climat "néo-Boréal"- retour au petit âge glaciaire

@MariuszDyminski - Mariusz Dymiński

@NiusMarco https://nora.nerc.ac.uk/id/eprint/11584/1/2008bams2370%252E1.pdf

404 File not Found - NERC Open Research Archive nora.nerc.ac.uk

@NiusMarco - marco nius

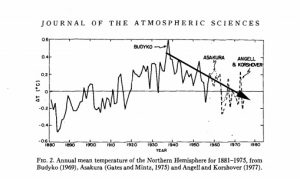
@MariuszDyminski On voit bien que les prédictions suivent la courbe des températures. 🤭

@MariuszDyminski - Mariusz Dymiński

@NiusMarco This is not a temperature curve. This is the curve for the number of publications.

@NiusMarco - marco nius

@MariuszDyminski Yes. And it's just follow the température curve. 1940-70 cooling , cooling publications.

@MariuszDyminski - Mariusz Dymiński

@NiusMarco 👍

Saved - August 22, 2023 at 9:21 PM
reSee.it AI Summary
The CIA's 1974 report warned of global climate change, predicting droughts, floods, famines, and mass migrations due to cooling. Unprecedented snow cover increase and 19 consecutive months of below-average temperatures in the Arctic were observed. Powerful civilizations like the Indus, Mycenaeans, Hittites, and Mali Empire declined due to past cold periods causing droughts. Climate changes at the end of interglacial periods are rapid and dramatic. Scientists predict regions like Canada, Europe, and the Soviet Union could be buried under 100-200 feet of snow within 2500 years. A massive cooling period of 70-180 years is expected, leading to agricultural decline, famines, and water shortages. Preparations, including grain reserves, are necessary to prevent the deaths of millions. Major meteorological organizations like NOAA were boosted to address the fatal consequences of cooling. The consensus is that we won't return to the warm climate of the past, requiring significant funding to predict the future climate. In summary, the threat of global cooling and its severe impacts on civilizations and ecosystems necessitate urgent action.

@NiusMarco - marco nius

TREAD 1/N rapport CIA 1974 Changement climatique Avec le consensus climatique mondial ils annoncent le CC avec sécheresses , inondations, famines, migrations massives à cause du refroidissement , climat "néo-Boréal"- retour au petit âge glaciaire https://t.co/fAGnagLApB

@NiusMarco - marco nius

Alertes en 70-74 - La couverture neigeuse a augmenté de 10-15% - 19 mois consécutifs avec des températures sous la normale en Arctique (inédit depuis 100 ans) - Sécheresse massive à Moscou - Inondations massives aux USA 😱 https://t.co/3WCdJ0pbdi

@NiusMarco - marco nius

énumération des civilisations tombées à cause de refroidissements qui entraîne sécheresses et inondations L'Indus; les mycéens, les Hittites, ou l'empire du Mali "les civilisations puissantes du passé (...) ont décliné à causes de périodes froides entraînant des sécheresses" https://t.co/DR7wZoMehz

@NiusMarco - marco nius

Le climat actuel interglaciaire a connu son optimum entre 5000 et 3000 avant JC Les changements du climat à la fin des âges interglaciaires sont rapides et dramatiques. En Europe les forêts de chênes peuvent être transformées en Bouleaux et Toundra en 100 ans https://t.co/W66U1DuOGA

@NiusMarco - marco nius

Les scientifiques sont sûrs que si l'homme ne parvient pas à modifier le climat les régions comme le canada , l'Europe ou l'Union soviétique se retrouveront rapidement (2500 ans ou avant) sous 100 ou 200 pieds de Neige https://t.co/gnzHsyyreE

@NiusMarco - marco nius

Le refroidissement va être massif pendant 70 à 180 ans avec des chûtes des rendements agricoles Le retour au climat du PAG avec déficit majeur de pluies et baisse radicale des moussons Famines https://t.co/4xsUVJzuGf

@NiusMarco - marco nius

Il faudra faire des réserves de grains pour éviter la morts de 150 millions d'indiens https://t.co/VgCKS762r4

@NiusMarco - marco nius

C'est donc pour le refroidissement fatal du changement climatique que les grandes organisations météo comme la NOAA ont été boostées https://t.co/GfWFJ8zMXE

@NiusMarco - marco nius

Le consensus , conférence de San Diego - Le changement climatique se met en place - On ne retournera pas au climat (chaud) du passé - il nous faut plein de pognon pour prédire le climat futur https://t.co/88NcyCldgw

@NiusMarco - marco nius

Bref on allait tous mourir de froid. Le lien vers le PDF https://www.hsdl.org/?view&did=725433

Saved - August 21, 2023 at 12:51 PM
reSee.it AI Summary
The conversation begins with @StatChrisCotton expressing concern about the high number of wildfires worldwide. @NiusMarco disagrees, sharing a link to statistics. @PaulPirson1 suggests that poorly maintained forests are to blame. @NoyauPeche questions the accuracy of flame emojis. The conversation abruptly ends with a mention of Keanu Reeves and China.

@StatChrisCotton - Christine Cotton OFFICIEL

Le monde entier est en train de brûler!! Statistiquement improbable d’avoir autant d’incendies sans intervention humaine. Terrible https://t.co/s8aF3lbBZs

@realstewpeters - Stew Peters

The entire world is currently burning and it’s not because of “climate change”.

Video Transcript AI Summary
Active wildfires are shown on Weather Underground through satellite images. The speaker saw a TikTok video of a girl showing the world burning and decided to verify it. The speaker confirms that all the wildfires shown are currently active. They express astonishment at the level of activity in Europe and Africa, questioning if Africa is okay. The speaker plans to move on to South America next and finds the situation abnormal. They ask for the listener's opinion.
Full Transcript
Speaker 0: Alright. What you're seeing behind me are active wildfires as identified by satellite. Now this is on Weather Underground. You can go, you can set the layers, and you can choose to pull this up. Now I saw this video going on on TikTok of this girl going through this, showing the world burning. And I had to I had to go check for myself because I just wanted to verify and make sure, and it was true. All of what you're seeing here are active Fires happening presently. And look at Europe. I mean, I've never seen this before. This amount of activity, This is all climate change. Right? I mean, look at Africa. Are they okay? Really? Because that is insane. And just wait once we we're going to go over to South America next. We're going to take a little hop over the pond. And look at that. This is I'm sorry. This just doesn't seem normal to me. What do you think?

@NiusMarco - marco nius

@StatChrisCotton @saraart4 Pas du tout https://gwis.jrc.ec.europa.eu/apps/gwis.statistics/seasonaltrend

@PaulPirson1 - Paul Pirson

@NiusMarco @StatChrisCotton @saraart4 Une forêt qui brûle, c'est une forêt mal entretenue.

@NoyauPeche - Le récit n'est pas la réalité

@NiusMarco @StatChrisCotton @saraart4 et qui est allé vérifier si derrière chaque émoticone "flamme" il y avait vraiment quelque chose ? Le récit versus la réalité. Zzzzzzzzzzzzzzz

@EpochSocal - Epoch Times—Southern California

Keanu Reeves Has A Message For China

Saved - August 19, 2023 at 12:11 PM

@NiusMarco - marco nius

Arnaque graphique classique. En commençant en 1983 ils montrent une corrélation entre les incendies aux USA et le CO2. En élargissant un chouia .....

@TonyClimate - Tony Heller

By hiding all the data before 1983 which wrecks their story, proponents of the #ClimateScam try to create the appearance of a non-existent correlation between CO2 and fire burn acreage. https://t.co/B1wboI2DDI

@warwick512 - Warwick

@TonyClimate

Saved - August 15, 2023 at 8:48 AM
reSee.it AI Summary
The Aletsch Glacier in Switzerland has been measured for 17,000 years. The higher the blue area, the longer the glacier. Since 1856, there has been a significant warming trend, marking the end of the Little Ice Age. In 1850, the glacier reached its largest extent in 11,500 years.

@NiusMarco - marco nius

Longueur du glacier D'Aletsch (suisse) depuis 17000 ans. Plus la zone bleue est haute plus le glacier est long . Je vous ai mis dans un rectangle rose la situation depuis 1856 (fin du petit âge glaciaire) qui représente l'énorme réchauffement actuel. 😏https://researchgate.net/publication/315058226_Beyond_debuttressing_Mechanics_of_paraglacial_rock_slope_damage_during_repeat_glacial_cycles_PARAGLACIAL_ROCK_SLOPE_MECHANICS

ResearchGate - Temporarily Unavailable researchgate.net

@NiusMarco - marco nius

1850 était la plus grande extension glaciaire depuis 11500 ans.

Saved - August 14, 2023 at 12:57 AM
reSee.it AI Summary
The conversation discusses temperature trends in Northeast Asia. @NiusMarco claims that temperatures are not hotter today compared to the 19th century or the 1940s, with the warmest period occurring in the medieval era. @Elpis_R agrees, providing examples of unbiased temperature reconstructions. @SbastienLauwers counters, stating that while some regions experienced warmer conditions during the medieval period, it was not a global phenomenon. @Elpis_R shares links supporting their argument. The conversation ends with @SbastienLauwers sarcastically acknowledging the information.

@NiusMarco - marco nius

Etude : Les températures (Asie du NE) ne sont pas plus chaudes aujourd'hui qu'au XIXe siècle ou dans les années 40. La période la plus chaude de l'ère commune s'est produite à l'époque médiévale (830-850 CE). derniers 170 ans, 8 des 10 années les plus froides depuis 1965.

@Kenneth72712993 - Kenneth Richard

New study: Temperatures (NE Asia) are no warmer today than the 1800s or 1940s. The warmest period in the Common Era occurred during Medieval times (830-850 CE). In the last 170 years, 8 of the 10 coldest years occurred since 1965. https://cp.copernicus.org/articles/19/1295/2023/cp-19-1295-2023.pdf

@Elpis_R - Ξlpis

@NiusMarco Chine / Asie : Toutes les reconstructions de température ou mesures thermométriques non biaisées montrent aucun réchauffement net ou une légère baisse ou période médiévale plus chaude qu’aujourd’hui. Voici quelques exemples.

@SbastienLauwers - Sébastien Lauwers

@Elpis_R @NiusMarco L'argument de la période chaude médiévale. C'est un vieux classique. Bien que certaines régions aient connu des conditions plus chaudes pendant cette période, ce n'était pas un phénomène mondial. Et on est loin au dessus : https://www.nature.com/articles/s41586-023-06176-4

Fennoscandian tree-ring anatomy shows a warmer modern than medieval climate - Nature Earth system models and various climate proxy sources indicate global warming is unprecedented during at least the Common Era1. However, tree-ring proxies often estimate temperatures during the Medieval Climate Anomaly (950–1250 ce) that are similar to, or exceed, those recorded for the past century2,3, in contrast to simulation experiments at regional scales4. This not only calls into question the reliability of models and proxies but also contributes to uncertainty in future climate projections5. Here we show that the current climate of the Fennoscandian Peninsula is substantially warmer than that of the medieval period. This highlights the dominant role of anthropogenic forcing in climate warming even at the regional scale, thereby reconciling inconsistencies between reconstructions and model simulations. We used an annually resolved 1,170-year-long tree-ring record that relies exclusively on tracheid anatomical measurements from Pinus sylvestris trees, providing high-fidelity measurements of instrumental temperature variability during the warm season. We therefore call for the construction of more such millennia-long records to further improve our understanding and reduce uncertainties around historical and future climate change at inter-regional and eventually global scales. Annually resolved Fennoscandian tree-ring anatomy records show that the climate of the current industrial era is substantially warmer than that of the medieval period. nature.com

@Elpis_R - Ξlpis

@SbastienLauwers @NiusMarco Oui, oui… 🙄 MWP (1270 études) : https://goo.gl/maps/K4xHfthynhjsamX19 https://t.co/eigYOZhr8f

@SbastienLauwers - Sébastien Lauwers

@Elpis_R @NiusMarco Ben oui...

View Full Interactive Feed