reSee.it - Tweets Saved By @USMortality

@USMortality - Ben
Canada's excess mortality increased by 400% after vaccination - that can't be normal!

@USMortality - Ben
Source: https://www.mortality.watch/explorer/?c=CAN&ct=weekly&e=1&df=2017%2520W01&ss=2017&ce=1&p=0
@USMortality - Ben
🔥🔥🔥 NEW SCIENTIFIC FRAUD IN NATURE? A study published by Puhach et al., 2022 including @EckerleIsabella & @BenjaminMeyer85 in @NatureMedicine is fraudulently misrepresenting the data to suggest that viral loads are significantly lower in vaccinated people by using inappropriate LOESS smoothing. That is not the case, as I can clearly show by my open source reanalysis of the raw data, when using mean and 95% confidence intervals. There's clearly no significant difference in "viral load" between vaccinated and unvaccinated at all! Screenshot: - Top: screenshot of study - Center: screenshot for Figure 3b/c of the study - bottom: re-analyzed chart with mean and 95% CI Code: https://gist.github.com/USMortality/9e6b16fa25e9785dfd659c402c170bd2 Study: https://nature.com/articles/s41591-022-01816-0#Sec18…


@USMortality - Ben
Here are all three methods: LOESS, MEAN, MEDIAN! LOESS is simply inappropriate, because it results in a too narrow confidence interval. There's clearly no significant difference when using a simple mean or median per day. https://t.co/8kEfM5kcOV

@USMortality - Ben
A reader notified me of a mistake in the CI calculation, here's the update chart. The conclusion still stands! https://t.co/MhThNTxCCN

@USMortality - Ben
For delta; the patients are listed in figure1 of the study. - unvaxx: 117 samples / 62 patients= 1.9 samples per patient - vaxx: 166 samples / 104 patient = 1.6 samples per patient So the datapoints are pretty much independent!
@USMortality - Ben
When using 6 days, they should have measured each patient every day, then plotted it to!
@USMortality - Ben
There’s no significant difference in FFU/mL based on the t-test results. Moreover, vaccinated individuals were entirely excluded from the analysis from day 0 to two weeks after their second dose. This creates a black box, leaving us with no information about what might have occurred during that period.

@USMortality - Ben
New peer reviewed study shows that neither vaccines nor previous infection protects from infection of later variants! - It's all a lie!

@USMortality - Ben
https://www.eurosurveillance.org/content/10.2807/1560-7917.ES.2024.29.26.2300659#html_fulltext
@USMortality - Ben
BREAKING: Official German Government Documents confirms, that the COVID-19 vaccines were possibly delayed on purpose until after the 2020 US election, thus possibly showing evidence of collusion! "Approval by the FDA before the US elections is not desired, nor by the European authorities, which means that there will not be initial results before November." @SenRonJohnson @SenTedCruz @SenRandPaul @michaelpsenger @elonmusk

@USMortality - Ben
This may suggest that the authorities did not want to get approval under president Trump, but wanted to wait - for supposedly political reasons - until after the election. Source: https://www.rki.de/DE/Content/InfAZ/C/COVID-19-Pandemie/COVID-19-Krisenstabsprotokolle_Download.pdf?__blob=publicationFile
@USMortality - Ben
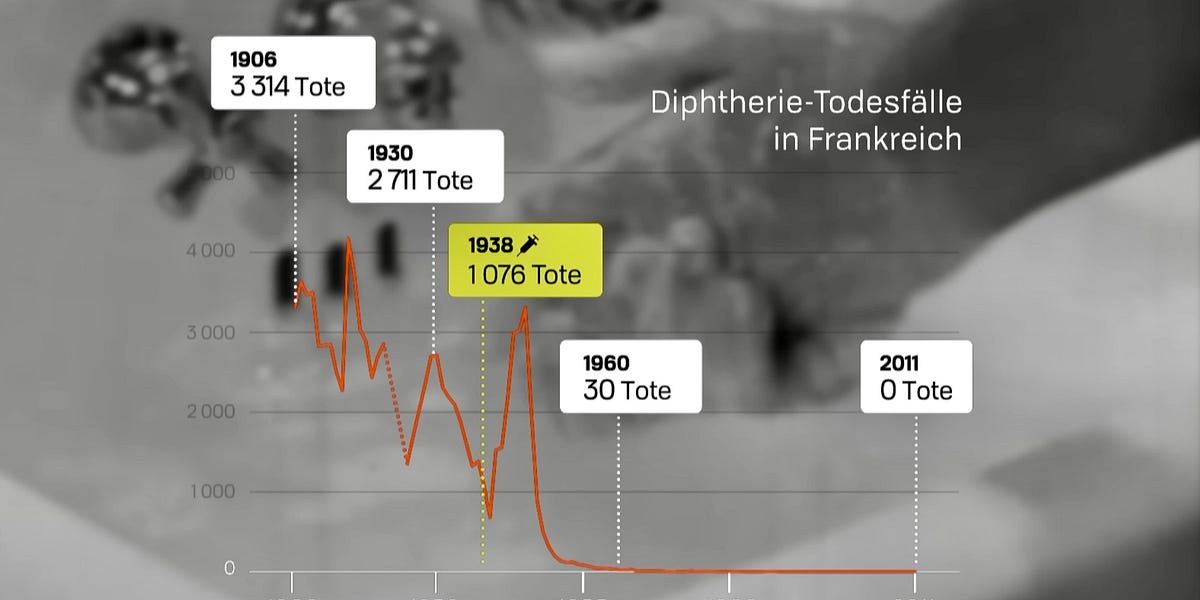
🔥 Some epidemiological charts for historic diseases and their vaccines. A thread 🧵1/n 1. Diphteria - Start of vaccination 1938 against diphteria in France is followed by an immediate spike in deaths, then return to pre-vaccination trend. (“Tote” & “Todesfälle” => “Deaths”)

@USMortality - Ben
2. Acute Poliomelitis (Polio) - Small spike after vaccination start in 1958, then sudden drop.

@USMortality - Ben
3. Measles - Vaccine introduced in 1983, long after deaths have been very low already. No clear change of pre-vaccination trend.

@USMortality - Ben
4. Tetanus - Huge spike after the vaccine was introduced in 1940. Then drop to almost 0 around 2000.

@USMortality - Ben
5. Human papilloma virus (HPV) - increase in cervical cancer incidence after vaccination start in 2006, not seen in unvaccinated age groups and countries with low vaccination rates.

@USMortality - Ben
6. Influenza - Population vaccine coverage of the yearly influenza vaccine in the USA increased from 51% in season 2010/’11 to 63% in 2018/’19. Influenza deaths also increased from under 10 deaths per 100,000 to almost 15/100k according to CDC’s calculations.

@USMortality - Ben
7. COVID-19 - After vaccination started on 12/8/2020 in the UK, and days later in the the rest oft the world, COVID-19 attributed deaths first increased, then remained high for over a year, to then sharply decline with the Omicron variant.

@USMortality - Ben
In all these charts, it remains unclear how the curves would have looked like without vaccination, but except maybe in the case of polio the effectiveness of the vaccines should clearly be up for debate.
@USMortality - Ben
Especially when we are looking at other statistics, which show interesting correlations, such as all-cause mortality.
@USMortality - Ben
8. All-Cause Mortality - Since the start of vaccination, deaths from all-causes in most countries have doubled or trippled further.

@USMortality - Ben
9. There are also other forms of diseases which seem to appear with an inverse relationship to the disappearing infectious diseases, such as multiple sklerosis, type 1 diabetis, asthma and allergies.

@USMortality - Ben
For sources and also to comment and subscribe, please visit my substack: https://usmortality.substack.com/p/10-epidemiological-charts-for-historic
@USMortality - Ben
For those of you who can understand German, great documentary: https://www.youtube.com/watch?v=oA_-rkCF0zM
@USMortality - Ben
10. Hepatitis - Diseases of the liver which are caused by a virus according to CDC. Since the introduction of the HepA and HepB vaccines in 1981, and 1995 respectively, deaths by hepatitis have increased 5x! https://t.co/ExrqfKzroD

@USMortality - Ben
After introduction of the Hepatitis A vaccine, deaths from that virus decreased, but deaths from this type are relatively low compared to the other variants. https://t.co/cUQ3XWeeYh

@USMortality - Ben
After the introduction of the Hepatitis B vaccine in 1981, deaths increased to almost 3x rate for this type. https://t.co/zGfqkd8JTj

@USMortality - Ben
We can also observe that other forms of hepatitis (not A/B) were steeply on the rise since the 1990’s, despite vaccination against the A/B variants. https://t.co/qZUEGEMmi7

@USMortality - Ben
There's a large pharma funded Measles Scare Campaign ongoing. The actual data doesn't support this.

@USMortality - Ben
@USMortality - Ben
@USMortality - Ben
https://docs.google.com/spreadsheets/d/1IB1xB2ccbbJA0rf_H0ln1jJwuCq3wMfwn-HT95V_qGE/edit#gid=1189781993


@USMortality - Ben

@USMortality - Ben

@USMortality - Ben
Not even the studies that are linked in the MMR package insert, actually tested for measles case prevention:
@USMortality - Ben
Has the Measles (MMR) vaccine scientifically been shown to reduce measles cases or deaths? A deep dive into the scientific literature! ⬇️⬇️⬇️ A Vaccine For Measles Prevention CDC currently states (1), that they recommend the MMR vaccine to protect against measles. Two products are available: M-M-R II and PRIORIX. What is Measles? According to Mayo Clinic (2) a 'red, blotchy rash' usually appears on the face. Also, the following clinical symptoms are listed: Now that we know what clinical measles looks like, let's take a look at the package inserts of the two products! M-M-R II (rHA) Merck's package insert (3) lists the clinical trials on page 20. Here it says, that only the antibody response was compared against the previous M-M-R II HSA vaccine. --> No clinical indications as endpoints, no real placebo used! PRIORIX The second current vaccine, was also simply compared to the antibody response of M-M-R II. --> Also, here: No clinical indications as endpoints, no real placebo used! 1/2 (See next Tweet for continuation) Sources: (1) https://www.cdc.gov/vaccines/vpd/mmr/public/index.html (2) https://www.mayoclinic.org/diseases-conditions/measles/symptoms-causes/syc-20374857 (3) https://www.merck.ca/en/wp-content/uploads/sites/20/2021/04/MMR_II-PM_E.pdf (4) https://www.fda.gov/media/158941/download


@USMortality - Ben
Always remember, these are cases, that are not based on a statistical representative population sample, thus do not actually represent the true measles prevalence in the population.
@USMortality - Ben
Lastly, these are cases, not deaths. Even if cases for vaccinated were lower, this could also mean that it's based on misclassification (diagnosis bias), or other effects, that may lead to different forms of sickness. That's why all-cause illness and deaths are so important.
@USMortality - Ben
The correlation between vaccination and excess disability in the US is pretty stunning! https://t.co/XjanpE00CF

@USMortality - Ben
There's just no denying with this. The increase of disabilities in the US since Covid-19 vaccine rollout is statistical significant.


@USMortality - Ben
It has also nothing to-do with the general population growth, as "truthers" (actual pharma shills & dishonest fake news spreaders) like this guy "Daniel" like to claim. The signal remains clear and statistical significant.

@Truth_in_Number - Truth In Numbers (Daniel)
@DowdEdward The disability rate of this group has increased, VERY slightly, over a long time-horizon. Disabled percent of population, 16+ is 10.6% higher in June of 2023 than it was in January of 2010. This doesn’t show the dramatic rise, implied by the graph that @dowdedward posted.

@USMortality - Ben
Same chart with complete y-axis. It's clear. It's undeniable. There was nothing before vaxx rollout. It's not from Covid.

@USMortality - Ben
Automatically update charts (weekly) can be found here: https://s3.mortality.watch/charts/index.html?prefix=covid19/usa/ Open source code can be found here: https://github.com/USMortality/charts/blob/master/covid19/usa/disability.r

@USMortality - Ben
🔥Swiss insurance data shows a +100% increase of cancer medication recipients since start of vaccination! https://t.co/NFHakrhsEh

@kati_schepis - Kati Sch.
Die Gesundheitsdaten der Helsana (=grösster Krankenversicherer der CH) zeigen seit Einführung der COVID-Impfung einen Anstieg der „Krebsmedikamentenbezüger“ (Versicherte, die Krebsmedikamente benötigen) um > 100%. Kurzpräsentation Prof. Beck: youtu.be/3Z6rviCbCNg https://t.co/Rfd0PSQRYG


@USMortality - Ben
🔥 Median all-cause excess mortality in the 20 most vaccinated highly developed countries increased by +149% after vaccination rollout! #COVID #COVID19 #Vaccine #MRNA #Excess #ExcessDeaths Results In 2020 median excess mortality in the top 20 highly developed countries was +4.5%, with the mass vaccine rollout in 2021, it increases to +9.9% and even further deteriorated in 2022 to +11.2%. ❓ How many countries saw an improvement of relative excess mortality with mass vaccination? 📉 3 📈 17 ➡️ Only three countries saw an improvement in excess mortality, 17 had their excess mortality increase. ❓ How many countries achieved normal excess mortality levels (<1%) with vaccination? 📉 0 📈 20 ➡️ None of the countries saw a return to negative or close to zero excess mortality levels. Here are the individual excess mortality charts for all 20 countries: Methodology The 20 most vaccinated countries of the @OurWorldInData COVID-19 dataset were selected (min. 1 dose) and filtered by a very high Human Development Index (HDI) >=0.8 value. (1) Excess Mortality was assessed by age-standardized mortality rates, where available, otherwise crude mortality rate (CMR) was used. A conservative pre-pandemic three-year average 2017-2019 (as used by Levitt et al. (9)) of the mortality rate was used as baseline, except for the United Arab Emirates, where the average of 2018-2019 was used, due to limited data availability. Relative excess mortality was calculated by the @MortalityWatch tool, all links to charts can be found in the provided spreadsheet. (2) Discussion In contrast to general expectations, excess mortality continued and almost tripled with global mass vaccine rollouts. Considering, that: 1) The COVID-19 vaccines are said to offer a protection against death of up to 94%, according to the CDC, this should have led to a massive reduction in overall excess mortality, not an increase. (3) 2) 2020 IFR estimates by Ioannidis et al., already demonstrated a moderate IFR for all age-groups of 0.23%, and 0.05% for <70-year-olds. (6) 3) Subsequent virus variants decreased in CFR/IFR, a drop of 79% in IFR from previous variants was reported for the Omicron variant in 2022. (8) 4) Early variants of 2020 lead to many deaths in the most vulnerable, hence a temporary mortality deficit should be expected going forward. (“Pull forward effect”) 5) The early diamond princess outbreak of 2020, demonstrated that only about 20% of people tested positive. Since measures and awareness were non-existent at that point in time on the ship, it is clear, that a significant amount of the population must have pre-existing immunity. (7) 6) Use of a conservative three-year average baseline method. In many countries, a declining mortality trend can be observed pre-pandemic. In this case, the average method, could even lead to underestimation of excess mortality. Given these reasons, it appears mathematically impossible, for excess mortality to rise in subsequent years after a novel virus outbreak, and with a “highly effective vaccine” available. HDI was used as an indicator, to quickly control for several confounders, that typically impact mortality levels in lower developed nations. E.g. general health status, income levels, poverty levels, that typically impact health outcomes. A common example is when mistakenly comparing lower HDI countries such as eastern European nations, e.g. Bulgaria, with higher HDI countries. Often, restrictions & NPI's are brought forward as the reason why 2020 saw relatively fewer excess deaths. However, it is already established by now again - as it was pre-2020 for seasonal influenza - that none of the NPI's have significantly reduced the spread of COVID-19. (Meta studies by Cochrane and Johns Hopkins (4) (5)). Germany's R value already decreased below 0, before the first lockdown in March 2020, indicating the natural limitation of outbreaks. Sources & Data 1) https://github.com/USMortality/charts/blob/master/covid19/most_vaccinated.r 2) https://docs.google.com/spreadsheets/d/1yDFsp6hLD7Z9BhkVntJwd3G8vTADTwmtPx4TQ25MrBk/edit#gid=0… 3) https://covid.cdc.gov/covid-data-tracker/#vaccine-effectiveness… 4) https://cochranelibrary.com/cdsr/doi/10.1002/14651858.CD006207.pub6/full 5) https://sites.krieger.jhu.edu/iae/files/2022/01/A-Literature-Review-and-Meta-Analysis-of-the-Effects-of-Lockdowns-on-COVID-19-Mortality.pdf 6) http://web.archive.org/web/20201101000542/https://www.who.int/bulletin/online_first/BLT.20.265892.pdf 7) https://x.com/USMortality/status/1620665889757749249?s=20… 8) https://ncbi.nlm.nih.gov/pmc/articles/PMC9022446/ 9) https://sciencedirect.com/science/article/pii/S0013935122010817


@USMortality - Ben
Diamond Princess 2020 - only 17% of passengers were PCR positive, less than 9% symptomatic. 83% were not infected and already immune, hence PFR = IFR = 7/3700 = 0.19%!

@USMortality - Ben
Again noteworthy, due to the average baseline method, the increase is not due to a modeling artifact!
@USMortality - Ben
Here are the individual country charts: 1) United Arab Emirates https://next.mortality.watch/explorer/?c=ARE&t=cmr_excess&ct=yearly&cs=bar&dt=2023&bf=2018&bt=2019&bm=mean&pi=1&p=1&m=1&v=2 https://t.co/k8vNXfPSfx

@USMortality - Ben
2) Qatar https://next.mortality.watch/explorer/?c=QAT&t=cmr_excess&ct=yearly&cs=bar&dt=2023&bf=2017&bt=2019&bm=mean&pi=1&p=1&m=1&v=2 https://t.co/hXl5UXrczF

@USMortality - Ben
3) Portugal https://next.mortality.watch/explorer/?c=PRT&t=asmr_excess&ct=yearly&cs=bar&dt=2023&bf=2017&bt=2019&bm=mean&pi=1&p=1&m=1&v=2 https://t.co/MyDevWzyg7

@USMortality - Ben
4) Hong Kong https://next.mortality.watch/explorer/?c=HKG&t=cmr_excess&ct=yearly&cs=bar&dt=2023&bf=2017&bt=2019&bm=mean&pi=1&p=1&m=1&v=2 https://t.co/vIFHbi8PeN

@USMortality - Ben
5) Chile https://next.mortality.watch/explorer/?c=CHL&t=asmr_excess&ct=yearly&cs=bar&dt=2023&bf=2017&bt=2019&bm=mean&pi=1&p=1&m=1&v=2 https://t.co/UpZL8fHwlb

@USMortality - Ben
6) Singapore https://next.mortality.watch/explorer/?c=SGP&t=cmr_excess&ct=yearly&cs=bar&dt=2023&bf=2017&bt=2019&bm=mean&pi=1&p=1&m=1&v=2 https://t.co/a54sCWifZF

@USMortality - Ben
7) Argentina https://next.mortality.watch/explorer/?c=ARG&t=cmr_excess&ct=yearly&cs=bar&dt=2023&bf=2017&bt=2019&bm=mean&pi=1&p=1&m=1&v=2 https://t.co/EmvyHa6HVv

@USMortality - Ben
8) Canada https://next.mortality.watch/explorer/?c=CAN&t=asmr_excess&ct=yearly&cs=bar&dt=2023&bf=2017&bt=2019&bm=mean&pi=1&p=1&m=1&v=2 https://t.co/G4tKh4VCSw

@USMortality - Ben
9) Costa Rica https://next.mortality.watch/explorer/?c=CRI&t=cmr_excess&ct=yearly&cs=bar&dt=2023&bf=2017&bt=2019&bm=mean&pi=1&p=1&m=1&v=2 https://t.co/WoQVnAwQm5

@USMortality - Ben
10) Uruguay https://next.mortality.watch/explorer/?c=URY&t=cmr_excess&ct=yearly&cs=bar&dt=2023&bf=2017&bt=2019&bm=mean&pi=1&p=1&m=1&v=2 https://t.co/G2lKX8DFfo

@USMortality - Ben
11) Spain https://next.mortality.watch/explorer/?c=ESP&t=asmr_excess&ct=yearly&cs=bar&dt=2023&bf=2017&bt=2019&bm=mean&pi=1&p=1&m=1&v=2 https://t.co/7XcBxvDXwZ

@USMortality - Ben
12) Mauritius https://next.mortality.watch/explorer/?c=MUS&t=cmr_excess&ct=yearly&cs=bar&dt=2023&bf=2017&bt=2019&bm=mean&pi=1&p=1&m=1&v=2 https://t.co/bIOP1rcFYm

@USMortality - Ben
13) South Korea https://next.mortality.watch/explorer/?c=KOR&t=asmr_excess&ct=yearly&cs=bar&dt=2023&bf=2017&bt=2019&bm=mean&pi=1&p=1&m=1&v=2 https://t.co/QSMdVfQXaw

@USMortality - Ben
14) Italy https://next.mortality.watch/explorer/?c=ITA&t=asmr_excess&ct=yearly&cs=bar&dt=2023&bf=2017&bt=2019&bm=mean&pi=1&p=1&m=1&v=2 https://t.co/S9iAp1Oi8Z


@USMortality - Ben
16) Japan https://next.mortality.watch/explorer/?c=JPN&t=cmr_excess&ct=yearly&cs=bar&dt=2023&bf=2017&bt=2019&bm=mean&pi=1&p=1&m=1&v=2 https://t.co/nqe8QqRpDj

@USMortality - Ben
17) Bahrain https://next.mortality.watch/explorer/?c=BHR&t=asmr_excess&ct=yearly&cs=bar&dt=2023&bf=2017&bt=2019&bm=mean&pi=1&p=1&m=1&v=2 https://t.co/C7XDX9uUQV

@USMortality - Ben
18) New Zealand https://next.mortality.watch/explorer/?c=NZL&t=asmr_excess&ct=yearly&cs=bar&dt=2023&bf=2017&bt=2019&bm=mean&pi=1&p=1&m=1&v=2 https://t.co/XL9Lmkt6hb


@USMortality - Ben
There is no scientific high quality evidence that the COVID-19 vaccines have saved any lives. On the contrary, they have demonstrably caused many deaths, much more than any other Pharma product in history, and also caused many - often permanent - injuries. Here’s the evidence: VACCINE Safety: - Serious Adverse Events (SAE) are estimated to be in a range of 1 in 800 to 1 in 5000: - https://bmj.com/content/378/bmj.o1731/rr-0 - https://sciencedirect.com/science/article/pii/S0264410X22010283 - https://twitter.com/hugh_mankind/status/1590733326553600003 - https://twitter.com/JulikaBrand/status/1550013097917747201 - COVID-19 vaccines have caused at least 254 confirmed deaths in Germany, as confirmed by the official death statistics of the federal statistics office: https://usmortality.substack.com/p/german-government-confirms-254-vaccine - No one knows how all-cause mortality would’ve looked like without vaccine, but the fact that mortality stayed high or increased in 2021/2022 is evidence that at least one of the words of ‘safe & effective’ cannot be true: - https://twitter.com/profnfenton/status/1596948154339196930 - https://twitter.com/USMortality/status/1701930193101721613 - https://twitter.com/USMortality/status/1592549814344241152 - VAERS shows a never-seen-before hockey stick increase with the introduction of the vaccines, that has not been explained by the health authorities. European data shows the same. - https://twitter.com/P_McCulloughMD/status/1712156115587223750 - https://twitter.com/USMortality/status/1407009199020658689 - https://twitter.com/JesslovesMJK/status/1707703130547540320 - VAERS shows that most death reports occur in the first 14 days. This is why people who died within two weeks of vaccination were likely considered unvaccinated. - https://twitter.com/goddeketal/status/1682008709067681792 - Young & Healthy: US data shows, that mortality rates increased after the vaccine rollout in all age groups 0-9, 10-19, 20-29: - https://mortality.watch/explorer/?c=USA&t=cmr&ct=yearly&ag=0-9&ag=10-19&ag=20-29&v=2… Efficacy: - None of the RCT Studies, except the Johnson & Johnson, showed a statistical significant effect on all-cause mortality. The mRNA vaccines has each +1 death in the vaccinated group. Novavax yielded +4 in the vaccinated group. Why J&J produced much fewer deaths, is a mystery as AstraZeneca, that used the same approach, had equal deaths in both groups. Also, the non-covid deaths are not balanced in the JJ trial results, pointing towards evidence of incorrect randomization of participants. - https://twitter.com/TracyBethHoeg/status/1512105790441607168 - Summary of the six authorized COVID-19 vaccines in US and EU. None of them were able to show statistical significance in regard to COVID-19 deaths or all-cause mortality (except JJ, as explained above) - not even in combination with 175 thousand test subjects. - https://twitter.com/USMortality/status/1577776630818283542 - Correlation DOES NOT EQUAL Causation: The Correlation between High Vaccinated and Low Mortality Countries, that the ‘Real Truther’ is describing, existed already before the vaccine rollout. If we look at before/after, no stat. Significant effect can be observed. - https://twitter.com/USMortality/status/1664118356725874690 - https://twitter.com/USMortality/status/1664043455801327616 - https://twitter.com/USMortality/status/1532100552535965697 - https://twitter.com/USMortality/status/1551149126364106754 - Higher unvaxed charts, are typically either confounded by general health status or manipulated via 14 day unvaccinated trick, lumping unknown vaccine status into the categories. My request to make the raw data public was denied, guess why? https://twitter.com/USMortality/status/1579474197503700999 - There are many examples of jurisdictions, where excess mortality exploded, after the vast majority of the population was vaccinated: - https://x.com/USMortality/status/1689356018105688064 - Not remotely possible that the vaccines have saved many lives! Excess mortality in seniors has increased by another +112% after more than 80% had already been vaccinated: - https://x.com/USMortality/status/1709011271071527057?s=20… - https://twitter.com/USMortality/status/1464985828904554496 - There are many countries that do not have any stat. Significant excess deaths, namely Luxembourg in southern Italy, so how do you explain that no unvaccinated are dying en-masse there either? - https://twitter.com/USMortality/status/1703492850137075764 - https://twitter.com/USMortality/status/1709039967555707013 - There’s no stat. signifificant advantage visible when comparing the UK all-cause data by vaccination status. Often, the unvaccinated have even lower mortality rates: - https://twitter.com/TheRustler83/status/1708969809583501695 - Dr. Rancourt discovered, that excess deaths are mostly correlated with poverty levels, and the poorest suffer the most from the lockdowns, but likely also from vaccinations: - https://twitter.com/USMortality/status/1667403684798668800 COVID-19 correlation - There's a simple explanation as to why COVID-19 deaths typically track with excess deaths - but only in western/wealthy countries! Most western countries have incentivized coding seasonal respiratory illnesses as COVID-19 & also apply their own death certificate modeling on top of that, such as what CDC does with the NVSS/MMDS! - https://twitter.com/USMortality/status/1709325123910869088 - Wastewater surveillance cannot be used to establish the claim, that Covid-19 was novel or to assess levels of virus, because genetic material from multiple strains and persons are mixed or pooled together, and no data from before 2020 (as control of the method) is available. - https://twitter.com/USMortality/status/1709645502659330151 - The COVID-19 PCR test has never been clinically validated! In contrast, most people that tested positive in hospitals were incidentals, i.e. test positive, but actually are not sick with a respiratory illness, such as COVID-19: - https://twitter.com/FLSurgeonGen/status/1707115008927166706


@USMortality - Ben
For 2022, unfortunately the data does not line up, but there are clearly some weeks where only a fraction of deaths have a vaxx status. I'll keep investigating...

@USMortality - Ben
Pfizer mRNA vaccines contain up to 354x more DNA than allowed! #mrna #covid #covid19 #pfizer #vaccine


@elonmusk - Elon Musk
Just arrived in amazing 🇯🇵 Japan 🇯🇵
@USMortality - Ben M.
@elonmusk Can you inquire, why excess mortality in Japan is through the roof?

@Popssmith1 - Pops smith
@USMortality @elonmusk Death rate looks reasonably normal..
@USMortality - Ben M.
@Popssmith1 @elonmusk No

@USMortality - Ben M.
BREAKING: German Government confirms, there's no data that can back up the claims that COVID-19 vaccinated people have better health outcomes!!

@USMortality - Ben M.
🔥 The final age-adjusted excess mortality tally is here! For the entire pandemic time 'March 2020 - April 2023' out of the four biggest states, Florida performed best, California worst! @GovRonDeSantis @GavinNewsom

@USMortality - Ben M.
@USMortality - Ben M.
Out of the 10 most populous counties for which we have mortality data, only one is back to normal, and two are close! 🧵 1/11 USA - Not OK

@USMortality - Ben M.
Not OK

@USMortality - Ben M.
Close

@USMortality - Ben M.
Not OK

@USMortality - Ben M.
Close

@USMortality - Ben M.
Not OK

@USMortality - Ben M.
Not OK

@USMortality - Ben M.
Not OK

@USMortality - Ben M.
OK

@USMortality - Ben M.
Close!

@USMortality - Ben M.
The first tweet should obviously mention countries not counties, and here are the stats: - ok 1 - close 3 - not ok 6
@USMortality - Ben M.
Dr. Rancourt PhD: "There's a strong correlation to poverty, which is one of the pieces of evidence that allows you to say that this is not a virus. [..] No matter how you slice it, there's absolutely no correlation with age, which is a definitive proof that this cannot be COVID"
@USMortality - Ben M.
"During the covid period, all western countries cut antibiotics prescriptions by 50%, so they were not treating bacterial pneumonia." "The age structure of the excess mortality has changed as you move into the vaccination period."
@USMortality - Ben M.
"These peaks occur in very specific hotspots, but synchronously around the world [..] that from an epidemiological standpoint is strictly impossible, because the time from seeding of an infection to the sudden rise of mortality is completely uncertain."
@USMortality - Ben M.
"The virus absolutely refused to cross these borders, of course this is absurd, a viral respiratory disease is believed to spread, and it does not need a passport, and it does not respect borders, so that's yet another proof, that this is not a viral respiratory pandemic."
@USMortality - Ben M.
"You see, as a consequence of the vaccine rollout, there's a higher regime of mortality." "Same thing for each of the states in Australia." "The large peak [in the southern US] coincides with [the] vaccine equity [program]"
@USMortality - Ben M.
"You are injecting people, that are at high risk of dying when you inject the elderly" "Young adults, are above the exponential [risk]. There's a plateau of risk of dying for young adults."
@USMortality - Ben M.
And finally, Dr. Rancourt's conclusions: 1) If govt's had done nothing - no excess mortality. There was no pandemic, that caused excess mortality. 2) The measures that governments applied, caused excess mortality. 3) The vaccination campaign definitely caused excess mortality.
@USMortality - Ben M.
And finally, please follow Dr. Rancourt himself: @denisrancourt Watch the full video: https://rumble.com/v2ohtte-physicist-dr-denis-rancourt-presents-his-findings-on-all-cause-mortality-ot.html?s=09 Find all my latest work: http://mortality.watch