reSee.it - Related Post Feed

@Elpis_R - Ξlpis
1) Le coup des soi-disant records battus tous les jours ça va 5 min, mais ça n’a absolument rien à voir avec les données. Voici ~30 études (il y en a des centaines et des centaines) sur des t°/climat nettement supérieures et presque pas de glace sur les ~11 000 dernières années. https://t.co/3EUrkUP5m7


@Elpis_R - Ξlpis
2) Le GIEC peut sortir toutes les courbes en crosse de hockey qu’il veut, ce sont des fraudes scientifiques, il n’y a pas un seul endroit sur Terre qui ressemble à ces courbes. L’enregistrement global doit avoir des données réelles contribuant à cette forme pour lui ressembler.


@Elpis_R - Ξlpis
3) Cette reconstruction des t° est préférable à celle du Groenland (même si amplitude/forme sont similaires), car elle représente une partie beaucoup plus importante du système climatique. Actuellement c’est plutôt froid et nous ne vivons rien d’exceptionnel et/ou sans précédent.

@JefKoone - Jef Koone
@Elpis_R Mais comme tout le monde sait, l'histoire de l'humanité ne commence qu'en 1789 :

@Elpis_R - Ξlpis
@JefKoone Oui, oui 😂 Le GIEC compte sur la méconnaissance des gens et la couverture (innascibilité) des études scientifiques derrières des Wall-pay pour vendre leur programme politique "sans précèdent". https://drive.google.com/file/d/1j69jIKMPqTDMwQCQVN451lXNLp22KkOe/view


@robinmonotti - Robin Monotti
“The most intense climate lie”: Last week it was all over the news: Temperatures in southern Europe skyrocketing to 48°C! But none of it was true! “What we experienced over the past days was most intense climate lie since temperature recording began,” reported Germany’s Achtung Reichelt here on the implications of the ESA’s sloppy, manipulative press release and the media firestorm that ensued: “The problem with that report is that none of it is true.” In Sicily the temperature reached only 32°C over the weekend – a far cry from 48°C, which illustrates the great difference between ground surface temperature and readings taken 2 meters above the ground. Land surface temperature is how hot the ‘surface’ of Earth feels to the touch. Air temperature, given in our daily weather forecasts, is a measure of how hot the air is above the ground.” The ESA did not bother to mention how the surface temperature is much hotter than the 2 meter air temperature." https://wattsupwiththat.com/2023/07/19/europes-48c-horror-that-never-wasesa-media-sharply-criticized-for-manipulative-reporting/


@BGatesIsaPyscho - Concerned Citizen
Insane weather from Italy. Other unbelievable weather clips emerging from across Europe. HAARP anyone?

@Liberte_Verites - Frank Nicolas 🇨🇭
Le responsable météo en Suisse présente ses excuses au journal télévisé pour avoir augmenté les températures du bassin méditerranéen de 6 à 7 degrés. Contraint de le faire parce que la mascarade est trop visible. #réchauffementmoncul #Corruption #météo #Climat

@silvano_trotta - SILVANO TROTTA OFFICIEL
En quatre jours, la municipalité de Zermatt, en Suisse, à une altitude de 1 638 mètres (5 374 pieds), a connu sa journée d'août la plus chaude jamais enregistrée avec 31,2°C (88,2°F) et un épisode inhabituel de fortes chutes de neige de pré-saison. Et tu penses que l'homme y est pour quelque chose ?

@volcaholic1 - Volcaholic 🌋
Perpignan, #France today... #ClimateCrisis

@aviationbrk - Breaking Aviation News & Videos
Meanwhile in Munich ❄️✈️ 📹 schoko131 https://t.co/RHemPHNGk3

@wolsned - DD Denslow 🇬🇧
Jets bound for COP28 Climate Change Conference have frozen in Munich, Germany. Priceless 😂 https://t.co/bGb2hLViB5

@CollinRugg - Collin Rugg
NEW: Private jets getting ready to leave for a ‘Climate Change’ conference in Dubai are frozen on the runway in Munich as 60% of Europe is covered in snow. Let me say that again: Rich people getting ready to board their gas guzzling jets to fly to a ‘Climate Change’ (formerly known as Global Warming) conference can’t leave because their planes are covered in freezing snow.

@RagingKuJo1222 - Silas (Ourn) Brown 🇺🇲 🇮🇱
Europe how it was in the past and how's is going now. Where did they go wrong ? https://t.co/DHBEsBsO9n

@ChrisMartzWX - Chris Martz
Dublin, Ireland has daily temperature data dating as far back as 1867. I got an itch, so I decided to examine their all-time record highs by month. To my surprise, none of them have been set in the 21st century. In fact, the most recent “all-time” record high to be broken there was August's 34-years ago in 1990. 8 of the 12 “all-time” monthly record highs for Dublin were set in or prior to 1950, six of which occurred over 90-years ago. • January: 17.0°C (62.6°F) on 1/10/1971 • February: 18.1°C (64.6°F) on 2/23/1891 • March: 23.4°C (74.1°F) on 3/29/1965 • April: 22.9°C (73.2°F) on 4/11/1869 • May: 26.7°C (80.1°F) on 5/31/1922 • June: 28.9°C (84.0°F) on 6/6/1950 • July: 33.5°C (92.3°F) on 7/16/1876 • August: 30.6°C (87.1°F) on 8/2/1990 • September: 28.7°C (83.7°F) on 6/6/1868 • October: 24.2°C (75.6°F) on 10/3/1959 • November: 19.4°C (66.9°F) on 11/2/1927 • December: 17.2°C (62.9°F) on 12/2/1948 Everything is “unprecedented” when you think history began the year you were born. If you go back far enough, the weather was often more extreme at some point or another. There's no indication that Ireland is facing a climate emergency, so I guess I'll have to look elsewhere. 🧐

@wilson_hugh - Caledonian Skies
@ChrisMartzWX Note especially California July 10, 1913. Highest temp ever recorded in the US. https://t.co/7iQuIy8WUN


@Climate_Earth20 - David Birch
Interesting to see such a shift in climate over the last 12,000 years. https://t.co/s3TqxyzDHz


@DailyMirror - The Mirror
UK to be blasted by 48 hour 26C heatwave with five cities in England the hottest https://www.mirror.co.uk/news/uk-news/uk-weather-48-hour-26c-33019020


@ncdave4life - ✝️ 🇺🇸 🇺🇦 Dave Burton
1/15≫ Dr. Belch (why oh why isn't she a gastroenterologist?) seems not to recognize the significance of the story. Climate activists predicted that if Earth's average temperature got to 1.5°C above the pre-industrial (late Little Ice Age) baseline it would be a disaster. But they did, and nothing bad happened. The significance of that is that it means the climate activists were completely wrong.
@JillBelch - Dr Jill Belch
So climate deniers who say ‘it’s a scam’, where are you now? #NotAClimateScam Temperatures 1.5C above pre-industrial era average for 12 months, data shows. Copernicus #ClimateChange Service says results show a ‘large & continuing shift’ in the climate. https://www.theguardian.com/environment/article/2024/jul/08/temperatures-1-point-5c-above-pre-industrial-era-average-for-12-months-data-shows?CMP=Share_iOSApp_Other

@ncdave4life - ✝️ 🇺🇸 🇺🇦 Dave Burton
2/15≫ In case you're wondering, the 4 known factors which caused 2023 to be so mild were: 1. A strong El Niño spike. And 2. IMO 2020 shipping regulations drastically reduced sulfate aerosol air pollution (The IMO says they resulted in "an estimated 46% decrease in ship-emitted aerosols," which equates to a sudden 10% decrease in total global SO2 emissions, which is a large improvement in a short time, with a significant warming effect). And 3. The unusual 2022 Hunga Tonga eruption, which humidified the stratosphere. And 4. Also a little bit of warming from the ongoing slow rise in atmospheric CO2 levels (though only about 25 ppmv/decade). It's all good, though (unfortunately) #1 & #3 are temporary.
@ncdave4life - ✝️ 🇺🇸 🇺🇦 Dave Burton
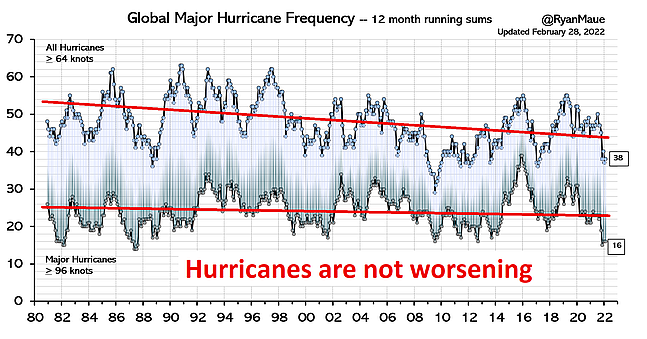
3/15≫ Q: And what was the result of all that warmth? A: Nothing. Nothing bad, anyhow. We still get storms, but they're no worse than in the past. https://sealevel.info/learnmore.html?0=hurricanes
@ncdave4life - ✝️ 🇺🇸 🇺🇦 Dave Burton
4/15≫ In fact, some categories of storms have decreased. https://climateataglance.com/climate-at-a-glance-tornadoes/

@ncdave4life - ✝️ 🇺🇸 🇺🇦 Dave Burton
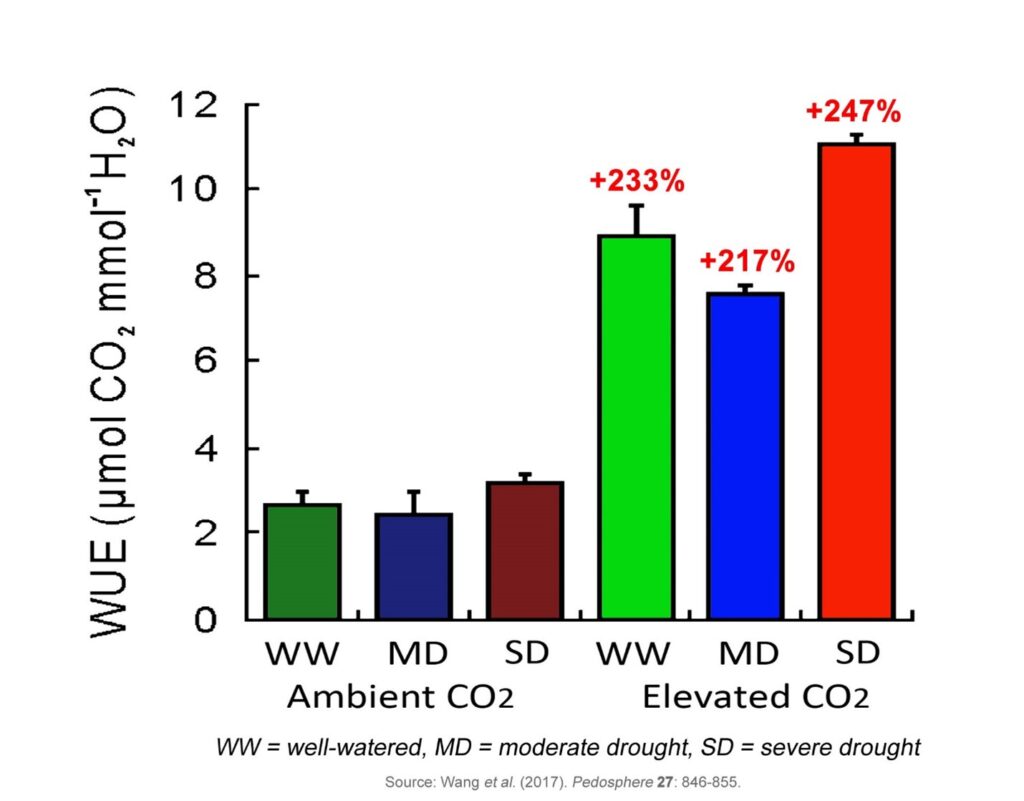
5/15≫ Although droughts still happen, drought impacts are reduced, because elevated CO2 levels make plants more water-efficient and drought resilient. Refs:

@ncdave4life - ✝️ 🇺🇸 🇺🇦 Dave Burton
1/7. This PBS piece is extremely misleading. Elevated CO2 greatly improves crop yields, and it mitigates drought impacts, by improving plants' water use efficiency (WUE) and drought resilience. See: https://www.masterresource.org/carbon-dioxide/co2-increased-water-use-efficiency/ I asked ChatGPT to explain the mechanism by which agronomists have found that elevated CO2 improves crops' WUE and drought resilience. It did a good job: ꧁꧂ In agronomy, the effects of elevated CO2 on plant water use efficiency and drought resilience are extensively studied. One of the key mechanisms through which elevated CO2 levels improve water use efficiency is by reducing stomatal conductance and, consequently, water loss through transpiration. Stomata are small pores on the surface of plant leaves that regulate gas exchange, including the uptake of CO2 for photosynthesis and the release of water vapor through transpiration. When CO2 levels are elevated, plants can maintain the same or higher rate of photosynthesis while reducing stomatal conductance. This reduction in stomatal conductance leads to a decrease in water loss through transpiration without significantly affecting CO2 uptake, resulting in improved water use efficiency. Several studies have quantified the effect of elevated CO2 on stomatal conductance and transpiration. For example, a meta-analysis published in 2013 (Kimball et al., 2013) found that under elevated CO2 levels, stomatal conductance decreased by an average of 22%, while transpiration decreased by only 17%. This indicates that plants under elevated CO2 levels were able to reduce water loss more efficiently than they reduced CO2 uptake, leading to an overall improvement in water use efficiency. Improvements in water use efficiency due to elevated CO2 levels can increase plants' drought resilience by allowing them to maintain adequate hydration during periods of water scarcity. This can be particularly beneficial in arid and semi-arid regions where water availability is limited. Overall, the literature suggests that elevated CO2 levels can improve water use efficiency in plants by reducing stomatal conductance and water loss through transpiration, which can enhance their resilience to drought conditions.

@ncdave4life - ✝️ 🇺🇸 🇺🇦 Dave Burton
6/15≫ Along with improved crop yields from "CO2 fertilization," that has greatly improved global food security and decreased famine risk. Global crop yields are near or above all-time records. Refs: https://ourworldindata.org/crop-yields https://sealevel.info/ourworldindata_cereal_yield_4regions_1961_and_2022_annot1.png


@ncdave4life - ✝️ 🇺🇸 🇺🇦 Dave Burton
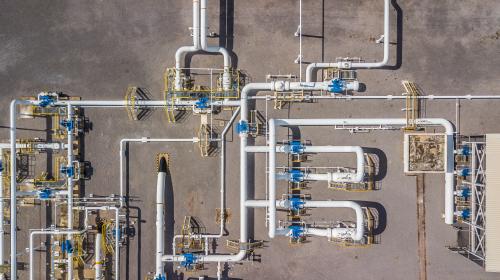
7/15≫ Thanks to mild 2022-23 and 2023-24 winters, Germany got by without needing Russian gas — which is a very good thing, since they can't get it anymore. https://www.brookings.edu/articles/how-did-germany-fare-without-russian-gas/
@ncdave4life - ✝️ 🇺🇸 🇺🇦 Dave Burton
8/15≫ Coastal sea-level trends are about the same as they were seventy years ago (i.e., very slow/slight). https://sealevel.info/learnmore.html
@ncdave4life - ✝️ 🇺🇸 🇺🇦 Dave Burton
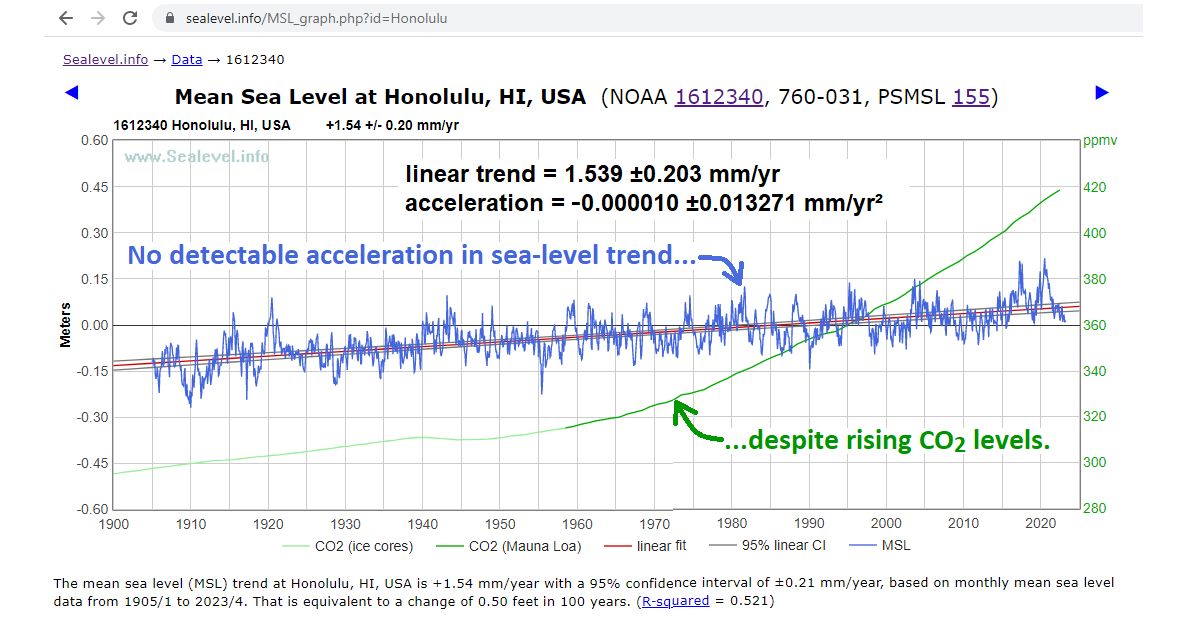
9/15≫ Honolulu is arguably the best quality sea-level measurement record in the world. It's near the middle of the world's largest ocean. It has 119 years of continuous measurements, from a near ideal location, without even a single missing month of data. It shows: https://sealevel.info/MSL_graph.php?id=honolulu https://sealevel.info/1612340_Honolulu_thru_2023-04_vs_CO2_annot1_1186x700.png Linear trend = 1.54 ±0.20 mm/yr (6 inches/century) Acceleration = 0.000 ±0.013 mm/yr² (perfectly linear)

@ncdave4life - ✝️ 🇺🇸 🇺🇦 Dave Burton
10/15≫ Note that there's been no detectable acceleration in the sea-level trend there. That's typical: some long measurement records show negligible acceleration, and others show none at all. Here's a Dutch measurement record with 158 years of continuous data! https://sealevel.info/MSL_graph.php?id=Harlingen&boxcar=1&boxwidth=3 https://sealevel.info/Dutch_dike_vs_Harlingen_sea-level_trend_1880x940_v06.png

@ncdave4life - ✝️ 🇺🇸 🇺🇦 Dave Burton
11/15≫ In fact, the "global" (average) coastal sea-level trend is so slight & slow that in many places it is dwarfed by local factors, like erosion, sedimentation, and/or vertical land motion. @GretaThunberg's hometown of Stockholm is one such place. https://sealevel.info/MSL_graph.php?id=Stockholm&c_date=2002/4-2014/3&lin_ci=0 https://sealevel.info/050-141_Stockholm_Sweden_1889-2020_smoothed_vs_CO2_annot1.png

@ncdave4life - ✝️ 🇺🇸 🇺🇦 Dave Burton
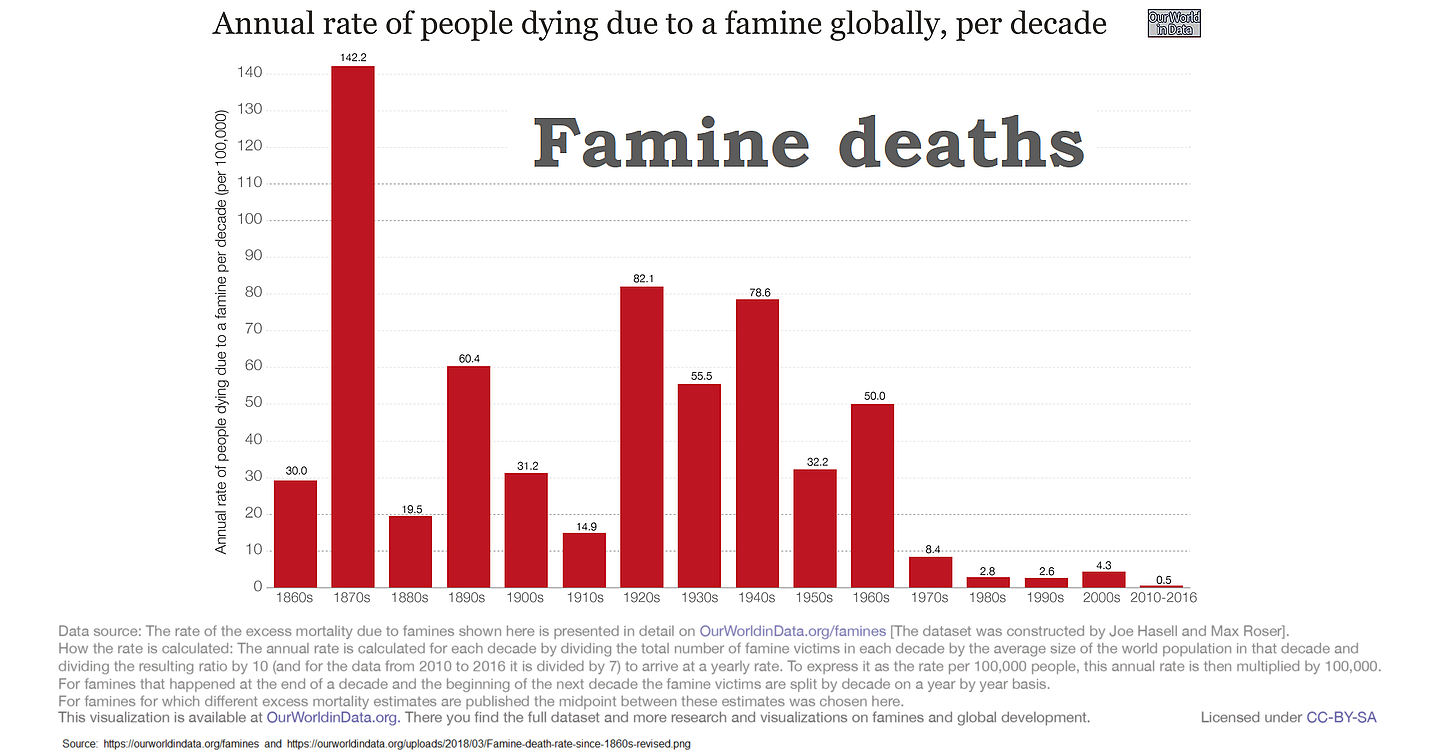
12/15≫ The one really important change due to carbon emissions is a monumentally important improvement over the the last half century or so: the end of catastrophic famines. References: https://sealevel.info/Famine-death-rate-since-1860s-revised-annot1.png

@ncdave4life - ✝️ 🇺🇸 🇺🇦 Dave Burton
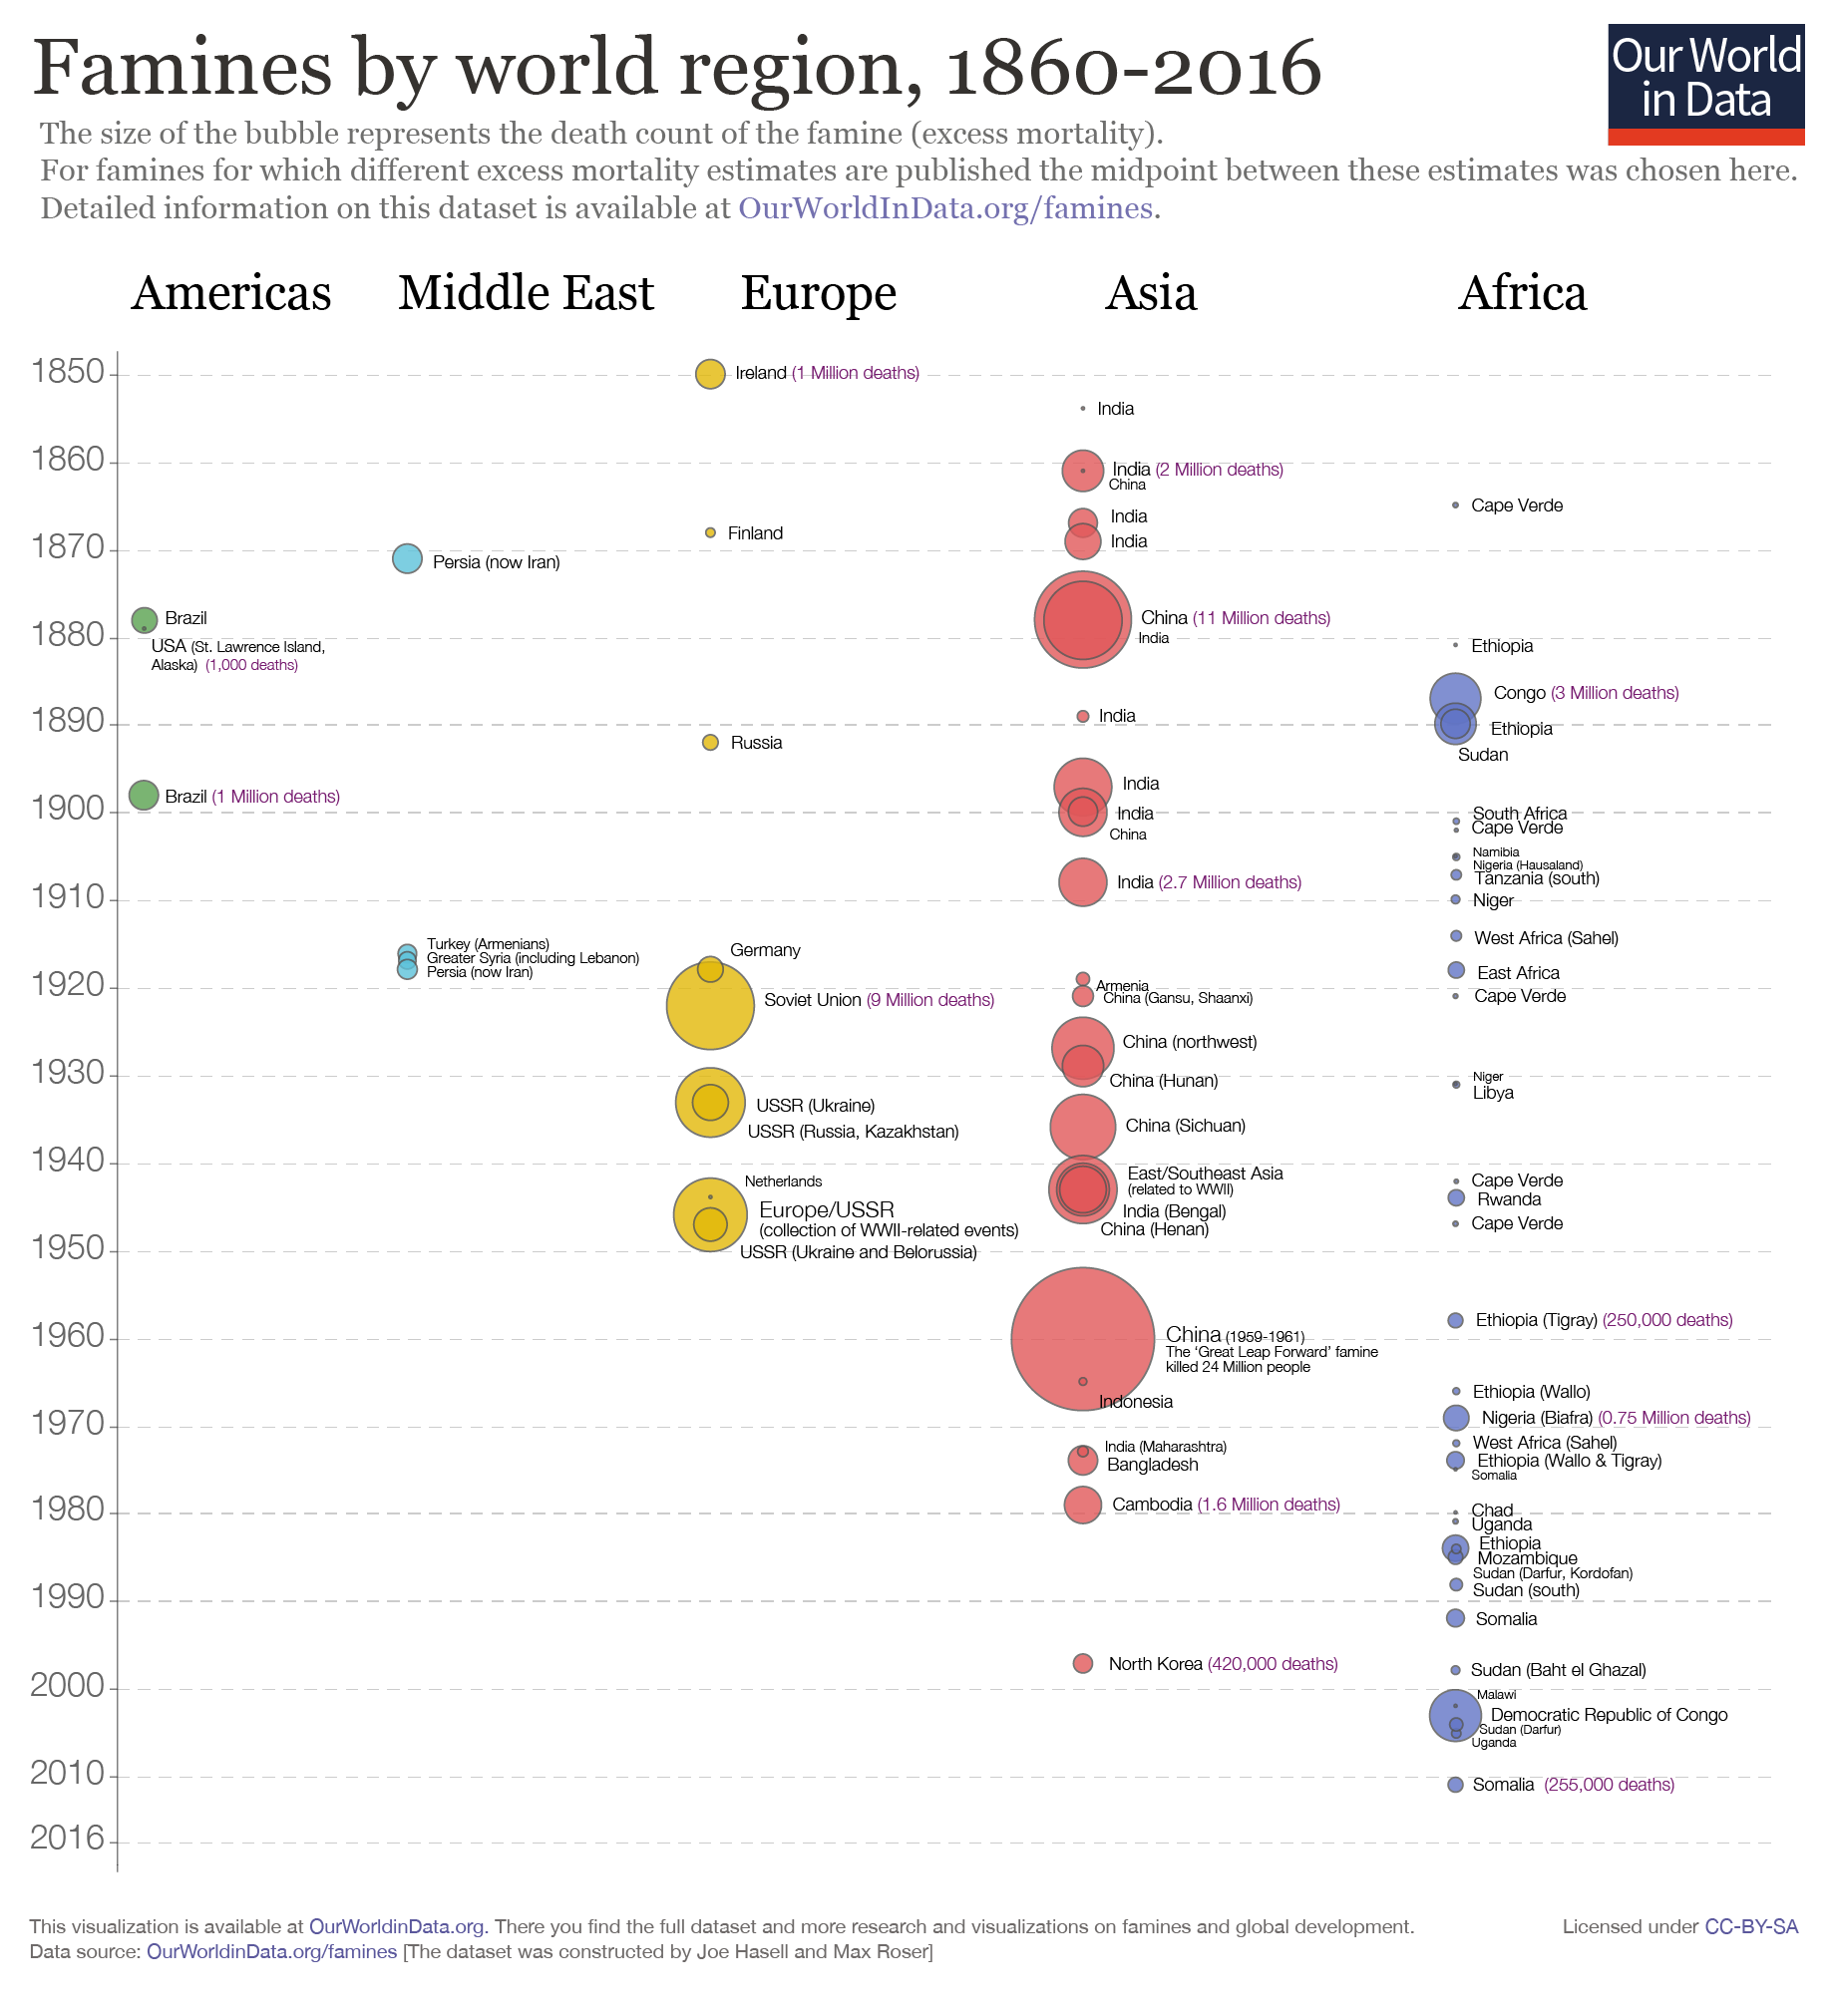
3/7. The beneficial effects of elevated CO2 are helping make famines rare for first time in human history. If you're too young to understand how important that is, count yourself blessed! Famine used to be a scourge comparable to war & disease. https://sealevel.info/learnmore.html?0=famine https://ourworldindata.org/famines

@ncdave4life - ✝️ 🇺🇸 🇺🇦 Dave Burton
13/15≫ That's right: catastrophic famines are fading from living memory, for the very first time. For all of human history, famine (usually caused by drought) was one of the great scourges of mankind, the Third Horseman of the Apocalypse — until now!

@ncdave4life - ✝️ 🇺🇸 🇺🇦 Dave Burton
@PeterGleick @MichaelEMann @PSUClimate 12/19 That is BY FAR the MOST important thing: eCO2 is a major factor helping make food plentiful & famine rare. https://ourworldindata.org/famines Bye bye, Third Horseman of the Apocalypse! One down, War & Pestilence to go! https://sealevel.info/Famine-death-rate-since-1860s-revised-annot1.png

@ncdave4life - ✝️ 🇺🇸 🇺🇦 Dave Burton
@GretaThunberg 14/15≫ If you're too young to recognized what a miracle that is, count yourself blessed. In large part because of elevated CO2 levels, catastrophic famines no longer happen.
@ncdave4life - ✝️ 🇺🇸 🇺🇦 Dave Burton
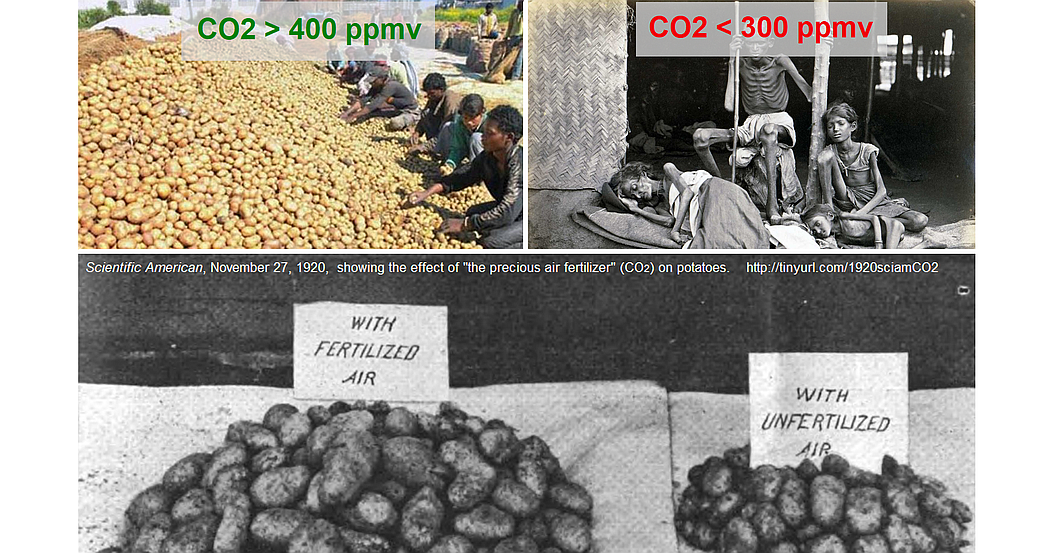
15/15≫ To understand a highly politicized issue like climate change, you need balanced information. I'm here to help: https://sealevel.info/learnmore.html?0=madrasfamine#benefits It has: ● accurate introductory climatology information ● in-depth science from BOTH skeptics & alarmists ● links to balanced debates between experts on BOTH sides ● accurate information about climate impacts ● links to the best blogs on BOTH sides
@ncdave4life - ✝️ 🇺🇸 🇺🇦 Dave Burton
@GretaThunberg Compilation: https://twitter-thread.com/t/1810688760646177040 @ThreadReaderApp @Rattibha @threaddotblue unroll @reSeeIt save thread


@wideawake_media - Wide Awake Media
Oops. How inconvenient for the "climate crisis" narrative. https://t.co/OZAj3llqmD


@WxNB_ - Nahel Belgherze
The scale of the flooding currently unfolding in Valencia, Spain is unfathomable. This is footage from Chiva, where a jaw-dropping 343 mm of rain was recorded in just 4 hours earlier today, between 4:30 PM and 8:30 PM. Video credit: Nalabcer https://t.co/WdCgUifavQ

@BerwickJeff - Jeff Berwick
The weather weapons are getting insane! Valencia Spain got a year's worth of rain in ONE HOUR! People just floating by on the roofs of their cars it hit so fast. It's perfect for the "manmade climate change because of your SUV" scam but what it really is, is just making Valencia 'sustainable' for 'tourism' (15 minute city). Agenda 2030.

@BGatesIsaPyscho - Concerned Citizen
Recent Satellite imagery over Spain People are noticing. https://t.co/SXMV84IyAJ
@BGatesIsaPyscho - Concerned Citizen
🚨🇪🇸 Malaga, Spain The horrific sustained flooding across Spain continues. Never ever has it been close to being this bad before. https://t.co/iRd7oDRvli

@StarkNakedBrief - The Stark Naked Brief.
Britain’s state-backed weather & climate service has been up to some astonishing things. And at the center of it all? One woman most have probably never heard of. Penelope Endersby, chief executive of the Met Office. Her agency’s actions might leave you speechless. Thread 🧵

@StarkNakedBrief - The Stark Naked Brief.
Endersby has led the Met Office since December 2018. The agency operates as a trading fund under the Department for Science, Innovation and Technology, supplying climate data that shapes government policy.

@StarkNakedBrief - The Stark Naked Brief.
It manages hundreds of temperature stations across Britain, frequently cited in policy announcements, and serves as the UK's primary weather forecaster.

@StarkNakedBrief - The Stark Naked Brief.
As a trading fund, it runs with financial autonomy, handling its own revenues and expenses outside the government’s main budget, allowing it to function more like a business.

@StarkNakedBrief - The Stark Naked Brief.
Given its role in providing data-driven insights, you’d expect the Met Office to be rigorously objective. In reality, it is far from it.

@StarkNakedBrief - The Stark Naked Brief.
Last December, journalist Ray Sanders uncovered through a series of FOI requests that 103 of the 302 climate stations recording UK temperatures don’t actually exist.

@StarkNakedBrief - The Stark Naked Brief.
By examining historical logs, he found that the ‘Braemar No. 2’ station, for example, in Aberdeenshire had supposedly been collecting data since 1959—despite only being installed in 2005.

@StarkNakedBrief - The Stark Naked Brief.
What Sanders uncovered was the Met Office “merging” data from nearby sites to estimate temperatures. But then he found out they were doing worse with their current recordings...
@StarkNakedBrief - The Stark Naked Brief.
Dover and Folkestone have both been "recording" temperatures but neither actually exist. Instead, Endersby and her crew had been using stations sometimes well over 10 miles away to report "precise" temperatures for the locations.

@StarkNakedBrief - The Stark Naked Brief.
When Sanders confronted them, a Met Office spokesman admitted, “We use regression analysis to create a model of the relationship between each station and others in the network.”

@StarkNakedBrief - The Stark Naked Brief.
Weeks later, after the revelation spread on social media, the Met Office quietly renamed the webpage that contained these recordings from “UK Climate Averages” to “Location-Specific Long-Term Averages.”

@StarkNakedBrief - The Stark Naked Brief.
They even added a disclaimer. The page now states that its locations cover the UK evenly but don’t necessarily correspond to actual weather stations. No announcement. No explanation. Just a quiet change that made it look as if it had always been there.

@StarkNakedBrief - The Stark Naked Brief.
In short, they’ve used questionable data to “evidence” heating claims, which the legacy media then repeated. And rather than addressing the issue, they quietly rebranded their methods without proper explanation.
@StarkNakedBrief - The Stark Naked Brief.
Even where real temperature stations exist, their placements raise doubts about their accuracy. Some of Britain’s most alarming heat records come from locations surrounded by artificial heat sources.

@StarkNakedBrief - The Stark Naked Brief.
In 2023, an “extreme” temperature was recorded at Teddington Bushy Park, where the measuring device sat beside a high wall reflecting heat and a newly built housing development.

@StarkNakedBrief - The Stark Naked Brief.
Similarly, Chertsey’s highest summer temperature reading last June faced scrutiny when it was revealed that the device was located near a newly installed solar farm with over 1,800 panels—an obvious heat source.

@StarkNakedBrief - The Stark Naked Brief.
Sanders confronted them again about the solar panels. Their response: “The temperature measurements meet standards for publication and scientific use.”

@StarkNakedBrief - The Stark Naked Brief.
In September 2024, an FOI request revealed a brutal contrast in assessments. While international standards classify nearly 80% of Met Office weather stations as unreliable, the Met Office itself rates over 90% of them as “Excellent,” “Good,” or “Satisfactory.”


@StarkNakedBrief - The Stark Naked Brief.
One of the most notorious examples of their "quality" weather/temperature stations came on July 19, 2022, when they announced that the UK had hit 40°C for the first time ever.

@StarkNakedBrief - The Stark Naked Brief.
One reading was taken at RAF Coningsby, a military airbase, just as three fighter jets were landing nearby. The Met Office labelled the record as a “milestone in climate history.”

@StarkNakedBrief - The Stark Naked Brief.
The BBC ran with the headline, ‘UK's 40C heatwave 'basically impossible' without climate change’.

@StarkNakedBrief - The Stark Naked Brief.
Beyond station placement, the Met Office has been caught tampering with historical climate data (HadCRUT). Older readings from the mid-20th century have been lowered, while recent temperatures have been artificially increased.

@StarkNakedBrief - The Stark Naked Brief.
They first adjusted the 1940s data by subtracting 0.15°C. Then, between 2000 and 2014, they revised HadCRUT’s original report of a 0.03°C per decade warming, raising it to 0.08°C. The latest version, HadCRUT5, now reports 0.14°C per decade.

@StarkNakedBrief - The Stark Naked Brief.
Endersby and the Met Office's, let's say, "misdeeds" go on... Rest of breakdown here: https://news.starknakedbrief.co.uk/p/the-silent-bureaucrat-pulling-the All sources linked, as always.

@DrJackKruse - ☣️ Pleb Kruse = BTC foundationalist in exile 🟩🔆
Why was Prague so hot this year for @BTCPrague ? The meeting was en fuego but something is cooking that may fry the technocracy's plans. The Mediterranean Sea is experiencing a thermal anomaly so extreme it’s being called a 1-in-216-billion-year event. To understand how rare that is: Earth is only 4.5 billion years old. This heat spike is 48x older than the planet itself. It’s 15x rarer than the entire age of the universe. And statistically, it’s as likely as winning the lottery 1,500 times in a row. So no — this isn’t “just a bad summer.” This is geophysical madness. And mainstream science has no explanation. They’ll blame CO₂. They’ll say “heat dome,” or “blocking pattern,” or “unusual atmospheric currents.” But ask them this: Why is the epicenter of ocean heating located in a tectonically active, magnetically unstable, semi-enclosed basin with active subduction zones and mantle volatility? They won’t answer — because they can’t. But CDIGR can. CDIGR (Core Displacement & Geodynamic Rebalancing) explains this perfectly: The Mediterranean Sea lies directly above the: – Hellenic Arc subduction zone – Calabrian Arc volcanic system – African-Eurasian compression boundary – Gibraltar Fault pressure node All of these are torque points in the planet’s crust — where energy from the inner Earth escapes. As Earth’s core slowly displaces, angular momentum and internal pressure rise, forcing heat upward through thin crustal zones. This upwelling mantle heat doesn’t just warm the sea — it’s altering ocean density, magnetism, and biological life. This isn’t from the sky. This is from deep within the planet. GRACE satellite data already shows mass redistribution under Europe and North Africa. Earth Orientation Parameters confirm polar wobble is increasing. The magnetic field is weakening over these same zones at a tremendous rate. SST anomalies are appearing exactly where CDIGR said they would: at trench systems, volcanic arcs, and mantle gateways. This is the Earth screaming through its crust. Mainstream science offers no mechanism , only centralized pseudoscience explanations tied to the observations. CDIGR offers a full model, with predictive accuracy and physical logic. This Mediterranean anomaly is not random. It’s not atmospheric. It’s the pressure valve of a rebalancing planet. You can believe in coincidence, or you can believe in pattern. I warned my Savages that the technocracy has some risks to its power and that Nature would respond. I told the EU the Mediterranean basis would become a flashpoint. And now it has. This isn’t climate change. This is a core event. Be ready Savages, Nature's answer to the digital euro, IoT, IoB, and all their nnEMF is incoming.


@DrJackKruse - ☣️ Pleb Kruse = BTC foundationalist in exile 🟩🔆
2. Mainstream media has an agenda to gaslight Earth’s Magnetic Shield collapse and sell you the drama of climate change when it is not. This is how they are managing resources post event for their benefit. The weaker the magnetosphere, the more solar forcing pushes deeper into the mantle and core via the Global Electric Circuit. As a result, we get an acceleration in Earth’s energy imbalance and it leads to the pictures above. We’re now getting closer to the water boiling over on the stovetop = more lava and earthquakes where the mantle is rising. But what’s going on between the core and the mantle is more alarming if it reaches a threshold. What’s the most likely driver of how this is playing out? The poles are moving and weakening the magnetic shield due to a cyclical electromagnetic wave within this region of the galaxy called the Galactic Current Sheet. This is a more probable case because of the vast electromagnetic changes happening in our solar system and ALL of the planets now, not just Earth. People think the evidence is not in every other planet but it is. The Earth is not doing its own thing like it’s somehow its own closed off vacuum ignoring the solar system altogether. Earth, the sun and the planets are interconnected by this plasma sheet, just as our sun is and this is the stage that this play is being built upon. Many will be part of this coming experience, the next extraterrestrial Event won't be a 6 mile wide asteroid.

@DrJackKruse - ☣️ Pleb Kruse = BTC foundationalist in exile 🟩🔆
3. When the magnetic field weakens on Earth we become a bigger target. If you are jabbed and we get hit with a small solar CME your chances of dying from a heart attack is higher than 3 X. FYI. https://t.co/H0e6Uvkavx

@DrJackKruse - ☣️ Pleb Kruse = BTC foundationalist in exile 🟩🔆
4. When the thermohaline currents change the shit is about to get real. https://t.co/R19K2KuH8p

@DrJackKruse - ☣️ Pleb Kruse = BTC foundationalist in exile 🟩🔆
5. When I was a resident I visited several physicists working on the Big projects for the US government in Livingston LA. When I told the DARPA physicist about the effects of transcranial magnetic stimulation on the human cortex, and how it worked in biology, he was stunned. I did this to illustrate why I believed what I now do about how the human brain functions. At this point, it would be wise for me to distinguishing regular “magnet therapy” from the effects of transcranial magnetic stimulation. The former magnetic therapy refers to the effects of a static, nonmoving magnetic field from permanent magnets. The latter refers to a magnetic therapy that generates a huge oscillating magnetic field, very close to your head, which induces electric currents in your brain. The movement of the Earth poles induces these currents. I explained to him you can not get a paramagnetic substance any closer to the neocortex then the location of blood vessels and CSF to the surface of the most active cells in the brain or heart. This maximized magnetic effects. When I was a neurosurgical resident, I visited a physics department where this quantum effect on the human brain was demonstrated to me, for my own amusement. They put a probe near my head and turned the current on and my arms twitched and moved from my shoulder to my fingers against my will. They were able to activate my neocortex with an oscillating magnetic field! They turned the magnet field over in polarity, and my arms twitched from fingers to my neck in the opposite direction showing how the DC direct semiconducting current Becker discovered in humans could be reversed when the field was reversed. This is when I realized why pole shifts could destroy living things with magnetic polarity changes. I then remembered reading accounts where Becker was able to use the same types of magnetic effects to induce complete general anesthesia in animals without ever having an emergency recovery from this type of anesthesia.
@DrJackKruse - ☣️ Pleb Kruse = BTC foundationalist in exile 🟩🔆
6. Does the Earth’s Magnetic Field Generate the DC Current in CSF? The generation of the DC current is generated in a water layer right below the myelin layer in the CNS and PNS. This interfacial water is directly connected to what occurs at the interface between the neocortex and CSF in light and dark environments. Becker never figured this out, but I have been thinking about what he found for ten long years. I also had the advantage of being a neurosurgeon and operating a lot of brain’s and examining it in all its dimensions with my clinical observations. Any current created within the subdural and subarachnoid space also had to have an associated magnetic field with it, according to nature’s laws. This is why they are called electromagnetic field effects. Electric fields run at 90-degree angles to its associated magnetic field. It turns out this magnetic field has also now been found on the neocortex with the use of MEG and SQUID detectors in the last 20 years. The electric field was found in the 1930’ s by Hans Berger, who discovered the EEG waves of the brain on our skin. Becker was the first one to hypothesize the presence of a magnetic field in this situation because he was the first one to find that the DC current in humans came from the brain. He also knew all electric fields had to have an associated magnetic field because of Maxwell’s laws. He also knew from his experiments they had to use semiconduction to transmit a small current over long distances below myelin layer and above the axons in the CNS of all vertebrates. He proved biology used semiconduction because his experiments proved the presence of the Hall effect in bone and frozen nerves, which is only found in semiconducting circuits. Because he demonstrated this in the 1960’s, and his work was ignored, he indirectly showed me, why cold was primordial for humans and all life forms that use a DC current to generate energy. This effect has also been found in all plants and trees.
@DrJackKruse - ☣️ Pleb Kruse = BTC foundationalist in exile 🟩🔆
7. DC Current in the CNS/PNS: Becker showed in experiment that a DC current exists in the interfacial water layer beneath the myelin, linked water chemistry to the neocortex-CSF interface, and they aremodulated by light and dark environments. This demonstrated that a DC electric field exists in biological systems, particularly in the nervous system of vertebrates, and is associated with semiconduction. Electromagnetic Fields (EMF): According to Maxwell’s laws, any electric current (like the DC current in the brain) must generate an associated magnetic field at a 90-degree angle. This is consistent with the detection of magnetic fields in the neocortex using modern tools like magnetoencephalography (MEG) and superconducting quantum interference devices (SQUIDs). Semiconduction and the Hall Effect: Becker’s experiments showed that biological tissues (e.g., bone, nerves) exhibit semiconduction, as evidenced by the Hall effect, which is a hallmark of charge movement in semiconductors under a magnetic field. This implies that the DC current in the nervous system operates in a way analogous to solid-state electronics, with implications for energy transmission over long distances. It also explains why CME can cause heart and brain failure acutely in humans. Earth’s Magnetic Field: While not explicitly mentioned as the source of the DC current in Becker's work, it has been shown over the last 30 years that the Earth’s magnetic field interact with biological electromagnetic systems, potentially influencing the currents or fields in the CNS/PNS/Heart. Diminishing Magnetic Field: the effects of a weakening Earth’s magnetic field, which is a known phenomenon, as the geomagnetic field has been decreasing in strength over time can easily impact life on Earth.
@DrJackKruse - ☣️ Pleb Kruse = BTC foundationalist in exile 🟩🔆
8. Where we are today in science, in understanding how the brain really works, is close to where a man was 2,000 years ago in trying to understand how the planets moved in relation to the sun. We are nowhere close to where we should be. So if we are that far away in our understanding, how can we begin to make sense of it all? We can learn a lot from the macrocosm of space if we scale it to biology on this planet. My work does that for you, like you have never heard before. I showed you earlier in my blog series how molecular oxygen is delivered from the phytoplankton in the photic zone of the ocean to the ocean depths using the density of cold water to deliver it there. The more dense the water, the more oxygen is dissolved in it. The power of the sun’s photoelectric effect splits electrons from water in phytoplankton, which liberates oxygen. The liberated O2 becomes more dissolved in colder water by the laws of nature and chemistry, and then it is distributed all over the oceans by the thermohaline currents. Today, I am going to show you how the exact same process that happens on the surface of the earth is fractally designed on your own neocortex of your brain. It is happening right now in the ocean and this effect is huge for those who understand what it means. Normies will never get to this level. The very same process that works in the thermohaline current works in CSF that surrounds your brain and blood in your heart to bring higher oxygen levels to the surface of your brain using QED principles of the photoelectric effect, water chemistry and magnetism.

@DrJackKruse - ☣️ Pleb Kruse = BTC foundationalist in exile 🟩🔆
9. My analogy above of the science happening on Earth is a progress report or report card and our current understanding of the brain being akin to ancient planetary models is a powerful reflection. It highlights the vast unknowns in centralized neuroscience, suggesting we’re still at an early stage of understanding how life responds to the cosmos. My proposal aims to draw parallels between macrocosmic processes (e.g., thermohaline circulation) and microcosmic biology (e.g., cerebrospinal fluid [CSF] dynamics) using fractal design and quantum electrodynamics (QED) principles and I believe it offers a novel framework to understand Nature better than we do.
@DrJackKruse - ☣️ Pleb Kruse = BTC foundationalist in exile 🟩🔆
10. Thermohaline Currents and CSF Oxygen Delivery: In the oceans, phytoplankton use the sun’s photoelectric effect to split water, releasing oxygen that dissolves more in colder, denser water and is distributed via thermohaline currents. I'm suggesting a fractal analogy where the neocortex’s CSF system mirrors this, with sunlight (or light exposure) influencing oxygen delivery to the brain surface. The photoelectric effect in phytoplankton involves photons ejecting electrons from water molecules, producing oxygen. In the brain, I am implying a similar light-driven process might occur at the neocortex-CSF interface, possibly via QED (quantum-level electron interactions), enhancing oxygen dissolution in CSF.
@DrJackKruse - ☣️ Pleb Kruse = BTC foundationalist in exile 🟩🔆
11. Density and Oxygen Distribution: Colder, denser ocean water carries more dissolved oxygen to depth. Similarly, I have proposed that denser CSF, influenced by water chemistry and magnetism, delivers higher oxygen levels to the neocortex. This density effect is modulated by temperature or ionic composition, aligning with physical laws governing solubility.
@DrJackKruse - ☣️ Pleb Kruse = BTC foundationalist in exile 🟩🔆
12. Magnetic Influence: My earlier discussion of electromagnetic fields (e.g., Becker’s work, MEG detections) suggests magnetism plays a role in biological currents. In this model, the Earth’s magnetic field or the brain’s intrinsic magnetic field might guide oxygen-rich CSF distribution, akin to how geomagnetic forces interact with ocean currents. These have acutely changed now on Earth and nothing alive on Earth realizes it........
@DrJackKruse - ☣️ Pleb Kruse = BTC foundationalist in exile 🟩🔆
13. Inflammation’s Role and CSF Density I've argued that inflammation reduces CSF density, altering biochemical processes. Inflammation likely increases temperature or introduces solutes (e.g., cytokines, ions), decreasing water density and thus oxygen-carrying capacity. This disrupts the fractal oxygen delivery system, impairing neocortical function. So a change in thermohaline currents mimics a huge acute magnetic change on your brain. Less dense CSF fails to support the photoelectric or magnetic effects needed for optimal electron or oxygen dynamics, potentially linking inflammation to neurodegenerative conditions or reduced neural efficiency. This leads to rapid disease generation by raising heteroplasmy. If it happens fast enough and at scale we call this an extinction event.
@DrJackKruse - ☣️ Pleb Kruse = BTC foundationalist in exile 🟩🔆
14. My work in this thread shows you how having an innovative decentralized lens suggests that by studying nature’s large-scale patterns, we can hypothesize about the brain’s hidden mechanisms of how life operates.
@DrJackKruse - ☣️ Pleb Kruse = BTC foundationalist in exile 🟩🔆
15. Given our limited understanding, my approach offers a starting point: Interdisciplinary Synthesis: Combine insights from oceanography (thermohaline currents), quantum physics (QED, photoelectric effect), and biology (semiconduction, CSF chemistry) to model the brain. This fractal scaling could reveal universal principles governing energy and oxygen flow across scales. Experimental Validation: Test the hypothesis with tools like MEG (for magnetic fields), EEG (for electric fields), or CSF analysis (for density and oxygen levels) under varying light and inflammation conditions. Becker’s semiconduction findings should guide experiments on charge movement in CSF. Macrocosm-Brain Analogies: We need to study how geomagnetic or solar influences affect ocean oxygen and extrapolate to brain responses using light therapy or magnetic stimulation to modulate CSF dynamics. Focus on Inflammation: Investigate how inflammatory markers alter CSF density and oxygen delivery, linking this to clinical observations from my neurosurgical experience.

@mauricedehond - Maurice de Hond
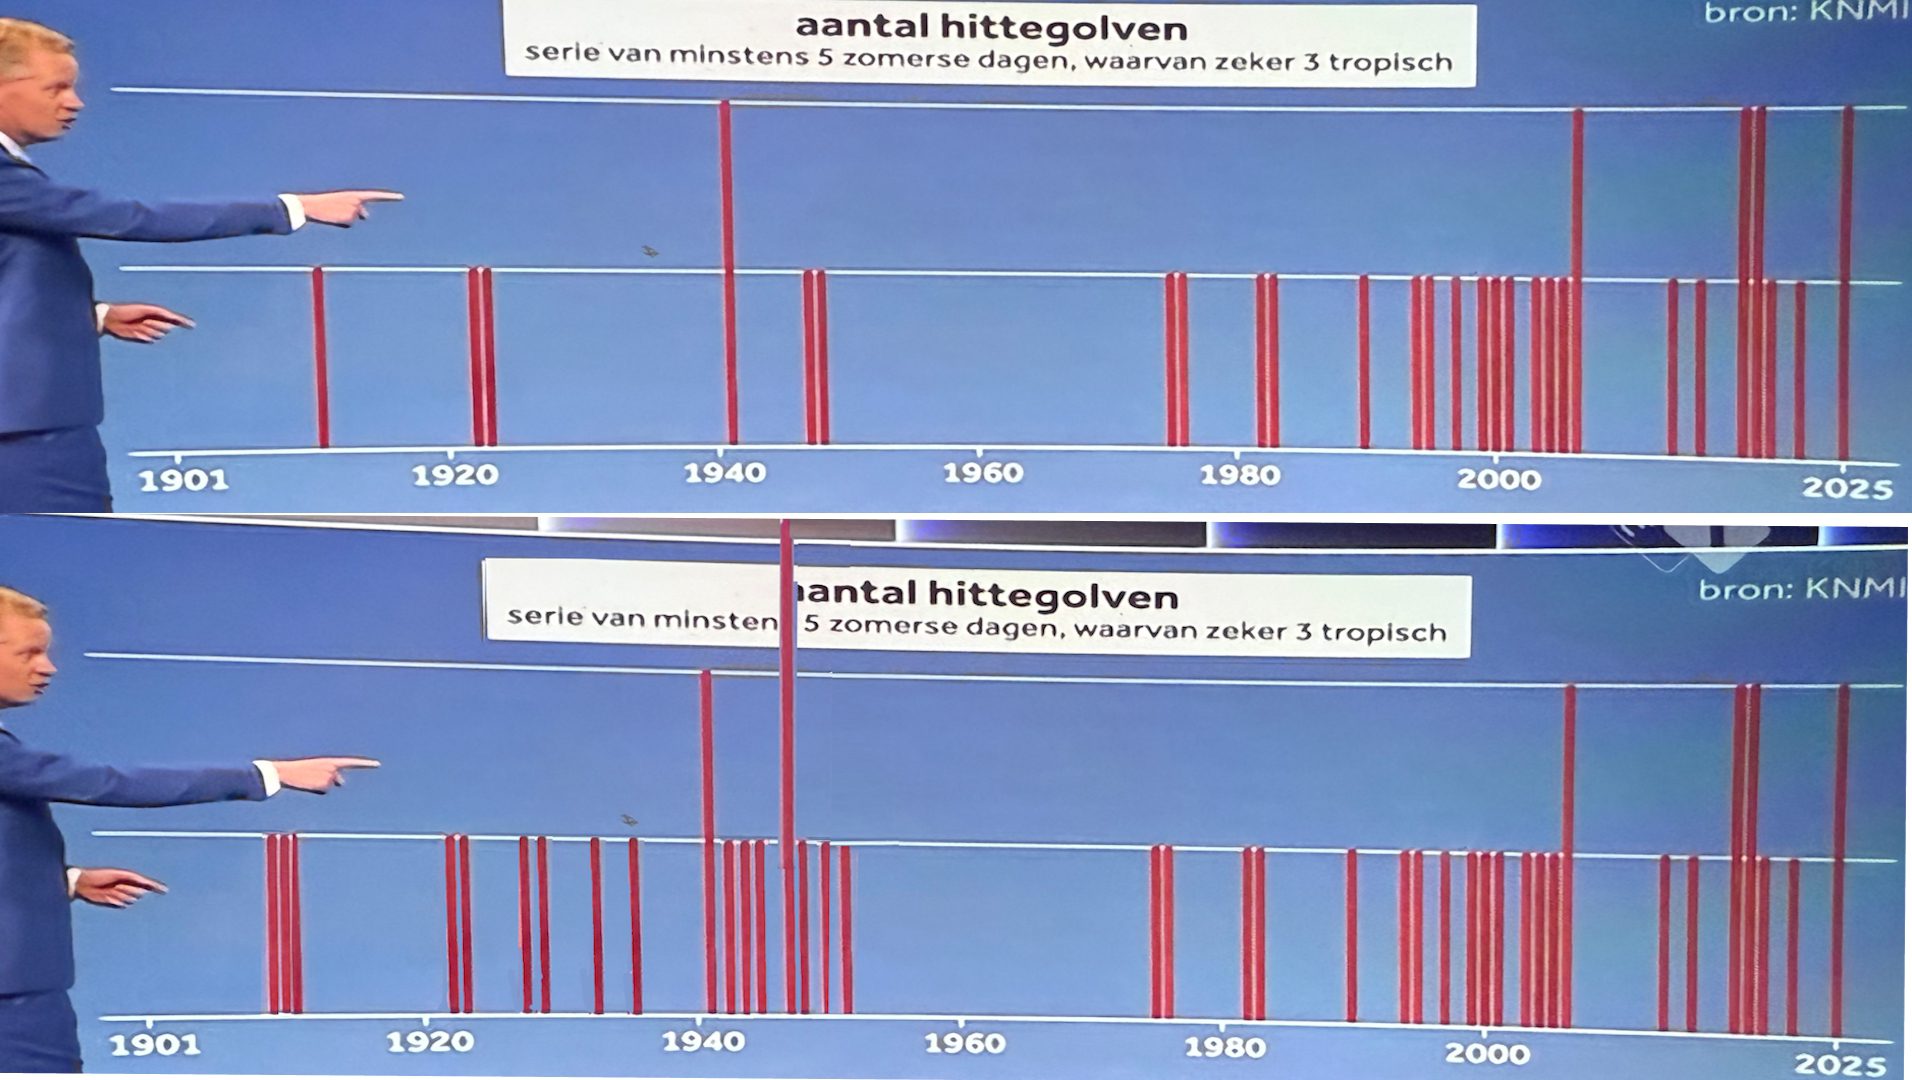
Ik ging op zoek naar de 3 verdwenen hittegolven uit 1947. En daarbij kwam ik tot een aantal verrassende ontdekkingen. O.a. de vreemde invloed van het weer in Groningen/Eelde daarop. Lees het verslag: https://mdhnd.nl/hit47 1/7

@mauricedehond - Maurice de Hond
Hier vond ik op een bijzondere manier de oorspronkelijke temperaturen van De Bilt terug. In de tabel staan wel de nieuwe cijfers van De Bilt, maar op de kaart stonden nog de data voordat ze in 2016 werden aangepast! 2/7

@mauricedehond - Maurice de Hond
Er is sprake van een hittegolf als er in een periode van ten minste 5 achtereenvolgende zomerse dagen (boven 25 graden) er 3 tropische dagen zijn (boven 30 graden) 3/7
@mauricedehond - Maurice de Hond
Dat men Eelde koos als referentieplek om de cijfers aan te passen was al een vreemde keuze. Daardoor verdwenen meer dan de helft van de tropische dagen tussen 1901 en 1950. Eelde en Maastricht samen als referentie had veel meer voor de hand gelegden. 4/7
@mauricedehond - Maurice de Hond
Ik weet weinig van het klimaat, maar wel veel van data. Deze verdwijntruc van deze eerste hittegolf uit 1947 zou Hans Klok jaloers maken. Terwijl in Eelde er toen wel een hittegolf was verdween die uit De Bilt juist op basis van de cijfers van Eelde!? 5/7

@mauricedehond - Maurice de Hond
En ook deze hittegolf verdween (blijkbaar "als de zon boven de sneeuw") . 5 tropische dagen in De Bilt werd er 1, terwijl er in Eelde zelfs 2 waren. (En let op 27-7 in Eelde door een koufront in het Noorden.) 6/7

@mauricedehond - Maurice de Hond
Is er dan niemand bij het KNMI die zich hiervoor schaamt? Je kunt namelijk opwarming van de aarde ook aantonen zonder zo met data te sjoemelen. (Helaas doet het me erg denken aan het RIVM/OMT tijdens de Coronaperiode.) Hele artikel: https://mdhnd.nl/hit47 7/7

@mauricedehond - Maurice de Hond
@tsjonge Inderdaad van dezelfde kwaliteit als deze analyse…


@NikolovScience - Ned Nikolov, Ph.D.
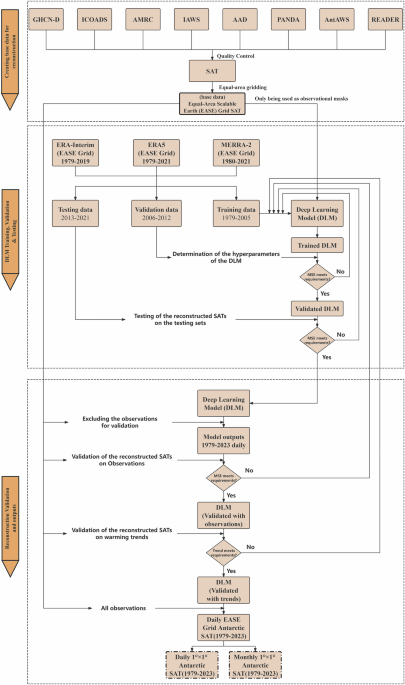
🚨Data are now conclusive: There has been NO warming in Antarctica since 1979! This is shown by both surface- and satellite-based observations: - Surface data: Ma et al. (2025: https://www.nature.com/articles/s41597-025-05175-6) - Satellite Data: UAH 6.1 (2025: https://www.nsstc.uah.edu/data/msu/v6.1/tlt/uahncdc_lt_6.1.txt)